12 results
Not grade specific statistics printable microsofts

Winter Themed Holiday Glyphs
These themed holiday glyphs include an elf, snowman, and reindeer. Use these glyphs as a single lesson on data collection, or refer back to them again and again. These engaging glyphs address skills like following instructions, collaboration, data collection, and analytical skills. Whether you are a seasoned vet with glyphs or trying them for your first time these FULLY CUSTOMIZABLE glyphs can be altered to fit the needs of any class or grade.
Subjects:
Grades:
Not Grade Specific
TpT Seller's Journal I Calendars and Monthly Planning
This monthly planner or BULLET JOURNAL is intended to help TpT sellers or ANY SELLER by recording and tracking stats and helping them organize and set goals for each month of the year! This file has a bullet journal style format with fun illustrations and designs for each month of the year. This file also comes with editable pages to create the journal page that best fits your needs.NOTE: There is a PREVIEW available for this file. Please, take a look and see if this activity is a good fit for y
Subjects:
Grades:
Not Grade Specific
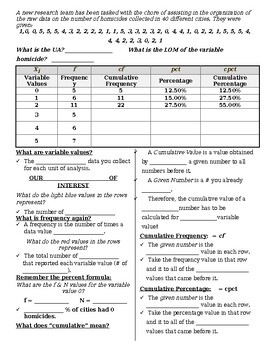
Univariate Stats: Frequency Distribution Table, Scaffolded Notes, Animated PPW
This Univariate Stats: Frequency Distribution Table resource contains scaffolded note pages that correspond to an interactive PowerPoint for your scientific method or statistics unit. There is a Tip & Tricks slide and corresponding note page that compiles feedback, notes, and helpful information I have personally seen benefit my students.Please be aware that this lesson was designed for a criminal justice-based statistics course; as such, topics and applied word problems use related themes.S
Subjects:
Grades:
Not Grade Specific
CCSS:
NGSS:
MS-LS4-6
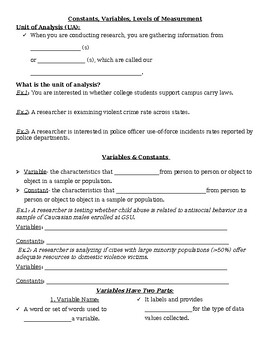
Constants, Variables, & Level of Measurement Scaffolded Notebook Pages
This constants, variables, and level of measurement resource contains scaffolded note pages that correspond to an interactive PowerPoint for your scientific method or statistics unit. There is a Tip & Tricks slide and corresponding note page that compiles feedback, notes, and helpful information I have personally seen benefit my students.Please be aware that this lesson was designed for a criminal justice-based statistics course; as such, topics and applied word problems use related themes.S
Subjects:
Grades:
Not Grade Specific
CCSS:
NGSS:
HS-LS3-3

Who is the Bowling Master?
In this activity, students will have the opportunity to evaluate scores of bowlers presented in histogram charts. Learning concepts to be applied include: minimum, maximum, mean, median, and more...
Subjects:
Grades:
Not Grade Specific
Types:
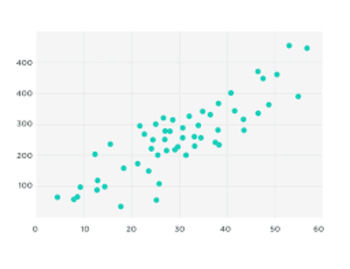
Scatterplot Scenarios
Got a severe case of scatter-brain? Need some ideas for your scatterplot? Look no more. In this document you will find 4 scenarios that you can use to create scatterplots with your class by hand, or using a computer-based application.
Subjects:
Grades:
Not Grade Specific
Types:

"Moneyball" Discussion Questions
Discussion questions for students watching the movie "Moneyball"
Subjects:
Grades:
Not Grade Specific
Types:
Step by step tutorial on how to create a chart in Google Sheets
This activity offers a step-by-step tutorial for students to use Google Sheets in creating a histogram chart for a set of numbers measuring the pH in water.
Subjects:
Grades:
Not Grade Specific
Types:
Template - Pie Graph
Print off to save you time creating it yourself
Subjects:
Grades:
Not Grade Specific
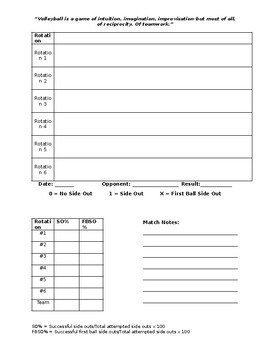
Volleyball Side Out Tracking Stat Sheet
Track your Side Out Percentage and First Ball Side Out Percentage with this detailed yet easy to use template. Includes rotation by rotation and whole team analysis.
Subjects:
Grades:
Not Grade Specific
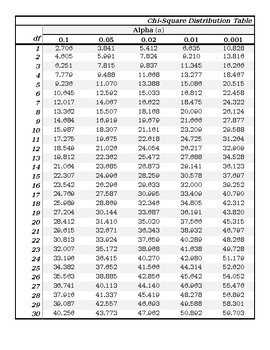
Chi-Square Distribution Table for Easy Student Use
Tired of trying to make the Chi-Square Tables you find online actually readable? Look no further! What makes this Chi-Square Table better?It only includes the five more commonly used Alphas, creating less confusion for students.The numbers, rows, and columns are clearly defined and easy to read.The document can be copied, pasted, and resized to include in your exams, homework, or notes. You can edit and change the table to fit your needs!Tables should be a tool that makes our lives and our stude
Subjects:
Grades:
Not Grade Specific
Types:
CCSS:
NGSS:
HS-LS3-3
, HS-LS4-3
Free Internet / Mobile Device Usage
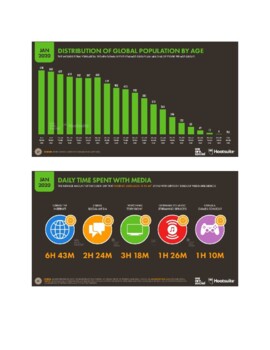
Pictures and graphs really help visual learners understand all the numbers and statistics in a lesson. These pictures and graphs were combined in one document for easy access. This document provides you with some basic numbers, charts and graphics based on current studies about the internet and usage in the world today. It helps bring focus to learners and show just how connected we really are.
Subjects:
Grades:
Not Grade Specific
Types:
Showing 1-12 of 12 results


