1,170 results
Statistics Common Core 6.SP.B.5c resources
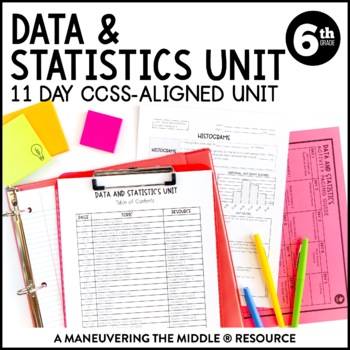
Data & Statistics Unit | Measures of Center, Dot and Box Plots, & Histograms
An 11 day CCSS-Aligned Statistics Unit - including statistical questions, describing data, and analyzing data with dot plots, box plots, and histograms. Students will understand measures of center and variability and how they relate to displays of data. Students will practice with both skill-based problems, real-world application questions, and error analysis to support higher level thinking skills. You can reach your students and teach the standards without all of the prep and stress of creatin
Subjects:
Grades:
6th
Types:
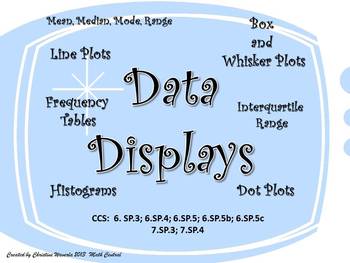
Data Displays: Line Plots, Histograms, Box and Whisker Plots, Frequency Tables
This is one of my favorite teaching tools! I created this Data Display set of worksheets this year for my 6th grade class. My students loved using these worksheets to practice their new skills. Each worksheet provides plenty of room for students to create their data displays and answer questions based on the data. Questions ask students to find the mean, median, mode, range, interquartile range, and percentages.These worksheets are fully aligned with the Common Core Curriculum.CCS: 6.SP.3; 6.SP
Subjects:
Grades:
6th - 8th
Types:
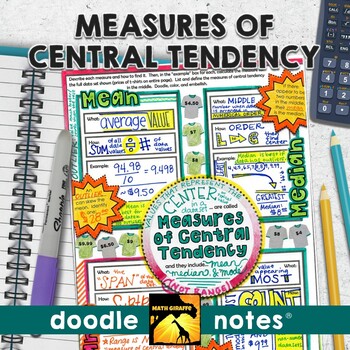
Measures of Central Tendency Doodle Notes (Mean, Median, Mode, & Range)
Mean, Median, Mode, and Range (Measures of Central Tendency): "doodle notes" - visual note taking pages with interactive tasks for building stronger retention of measures of center (mean, median, mode, and range) for your middle school statistics unit in Pre-AlgebraBoost your students' focus and memory! The blend of graphic and linguistic input in these guided visual notes helps students' brains to convert the information to long-term memory more easily.When students color or doodle in math clas
Subjects:
Grades:
6th - 8th
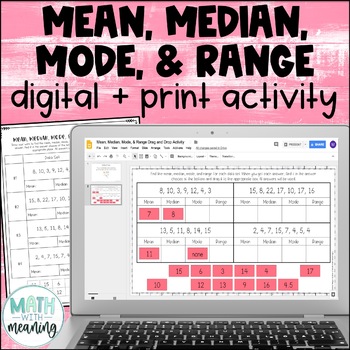
Mean, Median, Mode, & Range Digital and Print Activity for Google Drive
Looking for a fun, no-prep activity for finding mean, median, mode, and range? Students will find the mean, median, mode, and range for 4 data sets. They will then then find their answer from the answer choices at the bottom and drag it to the appropriate spot. Each data set contains 6-8 numbers. Please view the preview file to make sure that this activity is appropriate for your students.This product includes the following:A link to the digital activity on Google Slides including student direct
Subjects:
Grades:
5th - 8th
CCSS:
Also included in: Middle School Math Digital and Print Activity Bundle Volume 1
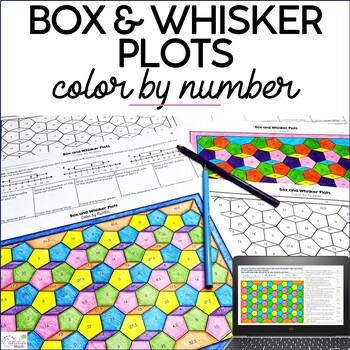
Box and Whisker Plots Color by Number Activity 6th Grade Math Coloring Pages
This box and whisker plots color by number activity includes two print and one digital version, offering engaging and versatile practice, while adding the mindfulness, wellness, and quietness coloring brings.Coloring in math has been shown to help reluctant students feel more comfortable with math:-)The box and whisker plot problems require students to identify:First quartile MedianThird quartile Interquartile rangeRange MinimumMaximum Number that would be in each quartile, based on a number of
Subjects:
Grades:
6th - 7th
Types:
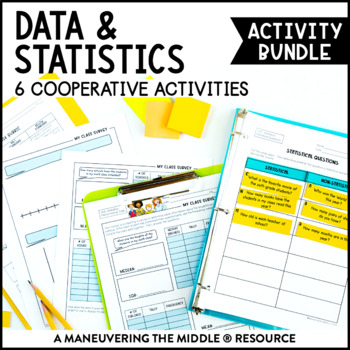
Data & Statistics Activity Bundle | Measures of Center, Histograms, & Box Plots
This Data and Statistics Activity Bundle includes 6 classroom activities to support statistical questions, histograms, box plots, measures of center and measures of variability. These hands-on and engaging activities are all easy to prep! Students are able to practice and apply concepts with these data and statistics activities, while collaborating and having fun! Math can be fun and interactive! Standards: CCSS (6.SP.1, 6.SP.2, 6.SP.3, 6.SP.4, 6.SP.5) and TEKS (6.12A, 6.12B, 6.12C, 6.12D, 6.13
Subjects:
Grades:
5th - 7th
Types:
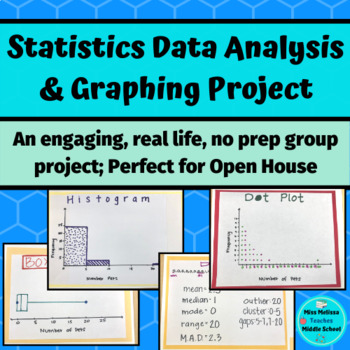
Statistics Project: Data Analysis & Graphing- real life, no prep
This statistics project is intended as a closure for your sixth grade statistics unit and aligns with ALL of the sixth grade statistics and probability common core state standards. In groups, students work together to choose a statistical question to ask the class. Once the class is surveyed, the group works together to create a frequency table, a dot plot, a histogram, and a box and whiskers plot. After creating their graphs, the groups analyze their data by looking at the mean, median, mode ra
Subjects:
Grades:
6th - 7th
Types:
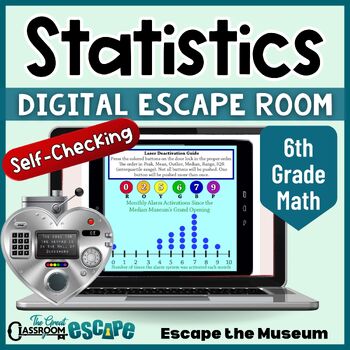
6th Grade Math Data Analysis & Statistics Activity Digital Escape Room Game
Find the median, read the box plot, interpret the frequency table, and unlock the door! This 6th grade math activity based on statistics and probability standards will put your students statistical skills to the test. Your students are volunteer docents at the Median Museum. After the security system locks everyone in, they will need to use their knowledge of statistics to escape the museum. This engaging digital escape room is easy for teachers to implement. The breakout process is fully autom
Subjects:
Grades:
6th - 7th
Types:
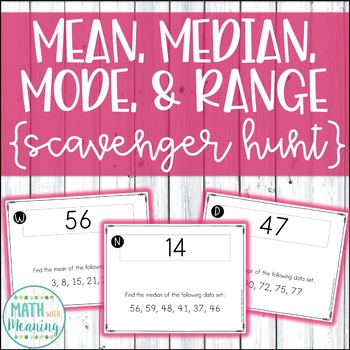
Mean, Median, Mode, and Range Scavenger Hunt Activity - CCSS 6.SP.B.5.C
Make practicing finding mean, median, mode, and range fun! This self-checking activity will allow students to get out of their seats and move around the classroom as they solve 16 problems. Each problem solved will lead the students to a new problem to solve until they have solved all 16 problems. You will be amazed at the math talk you hear and the collaboration between students as they work on this activity!Each data set includes 4-8 numbers. The answer to each problem is a whole number. There
Subjects:
Grades:
5th - 8th
Types:
CCSS:
6th Grade Math Task Cards | Math Enrichment Task Card Activities Bundle
These 6th grade math task card activities include 87 different challenging task cards to use as review, enrichment, math centers, or with early finishers. The task cards are designed specifically for 6th grade math topics. Concepts include geometry, algebra, numbers and operations, statistics, and other standards listed below. All task cards include a digital Google slides and printable option.Save 40% and get the majority of my math products, including this resource, at a large discount by purc
Subjects:
Grades:
5th - 8th
Types:
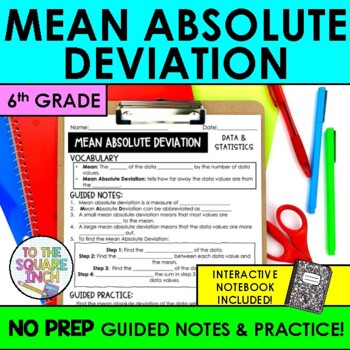
Mean Absolute Deviation Notes | MAD Guided Notes + Interactive Notebook Pages
Searching for an effective way to teach your students how to find mean absolute deviation? These NO PREP guided notes are a classroom proven resource that will save you time and have your students proficient in mean absolute deviation in no time! With a comprehensive design, these notes offer a structured approach that can be differentiated for every level of learner. Guided notes are an effective teaching model that maximize your students ability to use working memory to focus on content, rathe
Subjects:
Grades:
5th - 7th
CCSS:
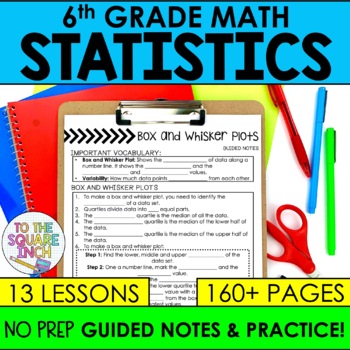
6th Grade Statistics and Probability Notes & Activities Unit | Data Sets
Looking for 6th grade guided notes for Statistics and Probability that are designed to help your students thrive and save you the time and energy of writing and designing them yourself? These NO PREP guided notes are a classroom-proven resource that will have your students proficient in entire 6th Grade Math statistics and probability common core standards. With a comprehensive design, these notes offer a structured approach that can be differentiated for every level of learner for the entire u
Subjects:
Grades:
5th - 7th
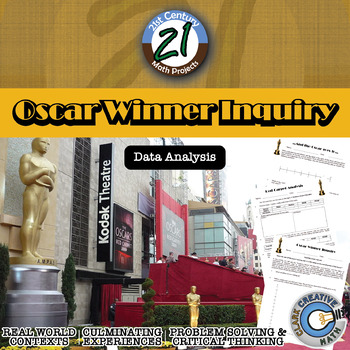
Oscar Winner -- Data Analysis & Statistics Inquiry - 21st Century Math Project
Utilize the last twenty years of Oscar winners as a data set to guide your students through creating box and whisker plots, histograms, and exploring mean, median, and mode -- in one 21st Century Math Project!Does the age of the award winning star in a film relate to the overall gross of the movie? Student will explore this inquiry question and use the data to support their conclusion.In this 8 page document you will be given a mapping to the Content Standards, an outline for how to implement t
Subjects:
Grades:
6th - 12th
Types:
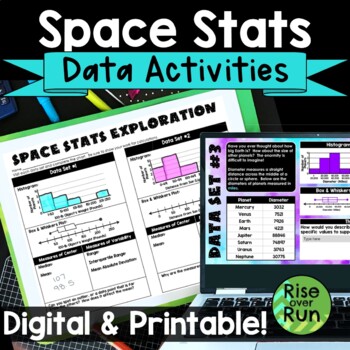
Box and Whiskers Plots and Histograms Activity with Real World Space Statistics
Use statistics for a real world application with this engaging activity about space stats! Students use real data to create histograms, box and whiskers plots, as well as calculate median, mean, range, interquartile range, and mean absolute deviation. This lesson works great for a space room transformation if you choose! Components are included in printable versions for in-person learning and Google Slides + Microsoft PowerPoint for online learning.Here’s what is included:Intro Presentation (Po
Subjects:
Grades:
6th - 9th
Types:
Also included in: Algebra 1 and 8th Grade Math Curriculum Bundle for Entire Year
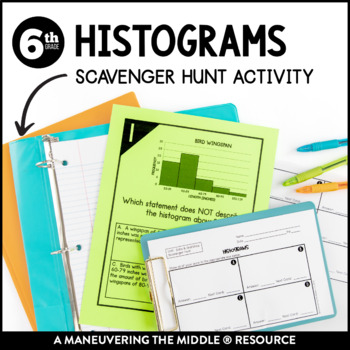
Histograms Scavenger Hunt | Interpreting Histograms Activity
This Histograms Scavenger Hunt consists of 10 clue cards where students must use the clue to interpret histograms. This activity focuses on analyzing histograms and determining which statements are represented in the histogram. This activity is great for in class practice! Students can get out of their seats and move around, while still applying their understanding of data and statistics. Students are able to practice and apply concepts with this histograms activity, while collaborating and havi
Subjects:
Grades:
5th - 7th
Types:
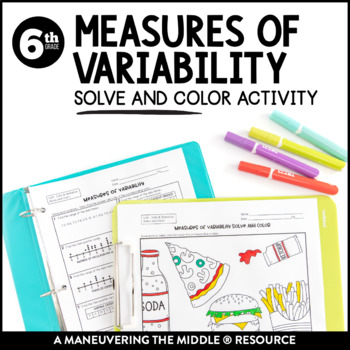
Measures of Variability Coloring Activity | Range & Interquartile Range Activity
This Measures of Variability Solve and Color consists of 8 problems where students will calculate the range or IQR from a data set, dot plot or table. Then, they will locate the answer and color the picture accordingly.This activity is great for in class practice or as a way to spice up independent work! Students can color, while still applying their understanding of measures of variability.Students are able to practice and apply concepts with this measures of variability activity, while collabo
Subjects:
Grades:
5th - 7th
Types:
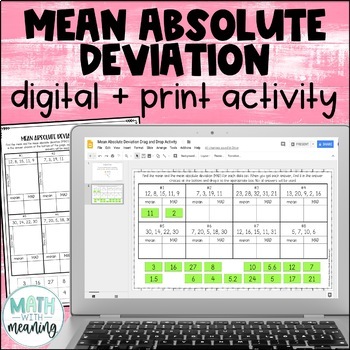
Mean Absolute Deviation MAD Digital and Print Activity for Google Drive
Looking for an engaging, no-prep activity to practice finding the MAD? Students will find the mean and mean absolute deviation for 8 data sets. They will then then find their answer from the answer choices at the bottom and drag it to the appropriate spot. Each data set contains 4-5 numbers. The mean of each data set is a whole number. Please view the preview file to make sure that these types of problems are appropriate for your students.This product includes the following:A link to the activit
Subjects:
Grades:
6th - 9th
CCSS:
Also included in: Middle School Math Digital and Print Activity Bundle Volume 2
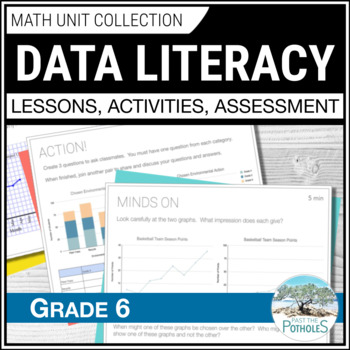
Data Management Unit: Reading Graphs Collecting & Analyzing Data Grade 6 Ontario
Save time and reduce stress!! This UPDATED Grade 6 Ontario Math Data Literacy unit has EVERYTHING YOU NEED. Students will learn about reading graphs, collecting data, analyzing data, misleading graphs, averages, and more. It includes 3-part Google Slides lessons, worksheets, games, centres, assessments, and report card comments. New histograms, broken-line graphs and infographic content are included with data analysis and data collection! SPECIFIC LESSON TOPICS:✓ Discrete and Continuous Data✓
Subjects:
Grades:
5th - 7th
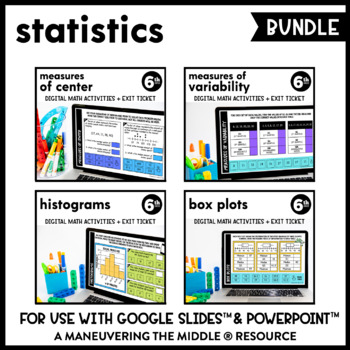
Statistics Digital Math Activity Bundle | Measures of Center | Google Slides
These supplemental digital math activities can be used to support data and statistics concepts. They are interactive (drag and match, using the typing tool, using the shape tool) and paperless through Google Slides™ and PowerPoint™. Topics Included:Measures of Center (4 interactive slides + exit ticket)Measures of Variability (4 interactive slides + exit ticket)Histograms (4 interactive slides + exit ticket)Box Plots (4 interactive slides + exit ticket)What is included?1. Paperless Math Activit
Subjects:
Grades:
6th
Types:
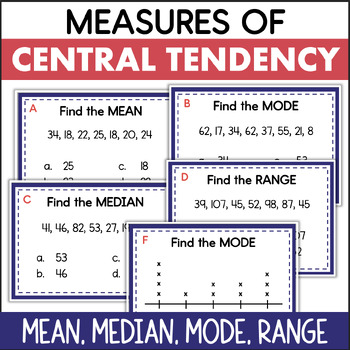
Mean Median Mode Range Measures of Central Tendency Data Task Cards
These data task cards are a great way for students to practice analyzing data to find the mean, median, mode, and range!There are several types of questions, all addressing measures of central tendency. Some require students to interpret a data set of whole numbers. Others involve data presented in a line plot. The last type of question requires the student to choose the correct method for finding the mean, median, mode, or range.This math resource includes:16 task cardsrecording sheetanswer key
Subjects:
Grades:
5th - 7th
Types:
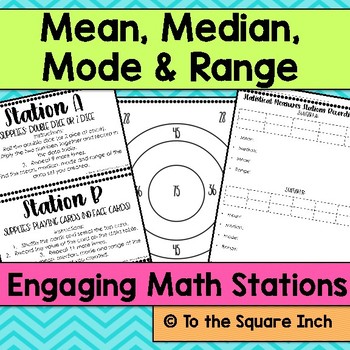
Mean, Median, Mode and Range Stations
These low prep stations allow students to create their own data sets in fun and engaging ways and then find the mean, median, mode and range of each. This classroom tested activity is a great way to get your students excited about measures of central tendency and variation.Included in this product: 6 different station instruction cardsRecording SheetBirthday Month ChartNumerical Months Birthday ChartBirthday ChartStatistics TargetSpinnerAdditional supplies needed for these stations:Double Dice (
Subjects:
Grades:
5th - 7th
Types:
CCSS:
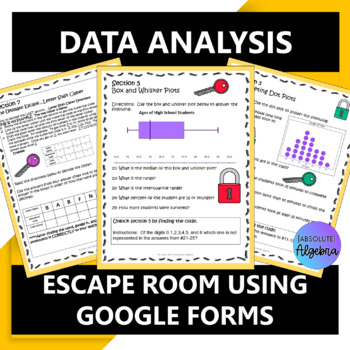
Data Analysis Digital Digital Escape Room using Google Forms
#overtherainbow Data Analysis Digital Escape Room Google FormsGive your students comprehensive practice on data analysis including variability, mean, median, mode, range, IQR, box and whisker, dot, stem and leaf plots, histograms, relative frequency tables, and more! This is a NO PREP Escape Room using technology! Just hand your students the worksheet, give them URL for the google form and they're ready to go!This resource includes:VariabilityMean, Median, Mode, Range, and Interquartile Range (I
Subjects:
Grades:
6th - 7th
Types:
Also included in: Middle School Math Activities Bundle
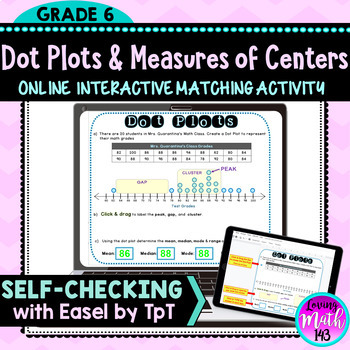
Dot Plots and Measures of Center Digital Activity for Distance Learning
Dot Plots & Measures of Center Interactive Activity for Distance LearningStudents will create a Dot Plot / Line Plot for a data set with 20 values. Students will identify the cluster, peak, and gap located on the Dot Plot. Students will also find the mean, median, mode, and range for the data set. it is a perfect resource for distance learning and students using Google Classroom™. This activity is interactive. Students will click and drag to move the dots to create the dot plot. In addition
Subjects:
Grades:
6th
Types:
Statistics & Data Display Project for 6th Grade Math PBL (Fully Editable)
This product includes a student guide for a 6th grade middle school mathematics project that will require students to develop a statistical question, conduct a survey with their classmates, create numerical summaries, represent their findings using visual data displays, and finally present their findings! The thorough student guide provides step by step directions for each part of the project and could be used as either an in class project or to be assigned as homework. The student guide also in
Showing 1-24 of 1,170 results


