TPT
Total:
$0.00
Selected
Subjects

Subjects

Arts & Music
English Language Arts
Foreign Language
Holidays/Seasonal
Math
Science
Social Studies - History
Specialty
For All Subject Areas
57 results

Science Common Core 6.SP.B.5c resources
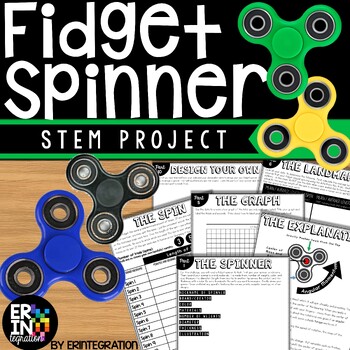
Preview of Fidget Spinner STEM Challenge Activities and Science Experiment
Fidget Spinner STEM Challenge Activities and Science Experiment

The ORIGINAL Fidget Spinner Stem Challenge & Science Lab! Discover the science of fidget spinners with this engaging and low-prep STEM activity. Practice scientific method with an exploration of variables, data collection, graphing, mean/average, and more...all while having fun!This self-paced, fidget spinner activity is print-and-go. Each activity sheet guides students through the project. STEM Challenge Overview:Students will use the included visual directions, graphic organizers, chart
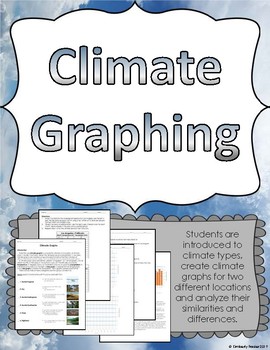
Preview of Climate Graphing Activity

Climate Graphing Activity

Created by
Kimberly Frazier
Help students understand the basics of climate through this graphing activity. Not only does this address the science standards, it also integrates math and data analysis.Included in this printable graphing activity:-Introduction to what climate graphs are-Descriptions of 6 major types of climates-Directions for how to make a climate graph-Climate graph set ups-Data for two locations: New York City and Los Angeles-Analysis questions comparing the two climate graphs (use of CER)-Set of climate gr
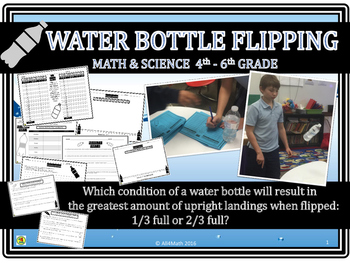
Preview of Water Bottle Flipping Math and Science: 4th - 6th Grade
Water Bottle Flipping Math and Science: 4th - 6th Grade

Created by
All4Math
My 5th & 6th graders FLIP for this math & science lesson! Students gather data using the scientific method to discover if a 1/3 full or 2/3 full water bottle will result in more upright landings. After writing their hypothesis, students flip water bottles 1/3 full and 2/3 full 20 times for each condition. They create class line plots of their data and find the median, mode, and mean of upright landings for both conditions. After analyzing their results, they write their conclusions. An e
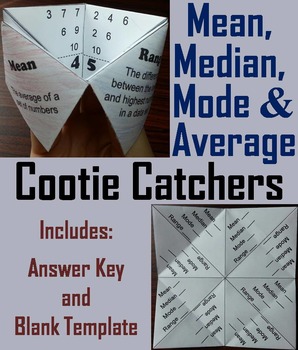
Preview of Mean Median Mode Range Activity (Measures of Central Tendency Activity)
Mean Median Mode Range Activity (Measures of Central Tendency Activity)

Created by
Science Spot
Mean, Median, Mode and Range Cootie Catchers: These cootie catchers/ fortune tellers are a great way for students to have fun while learning about the mean, median, mode, and range of data sets.This product includes the following: 1. How to Play and Assembly Instructions2. Cootie Catcher with data sets w/ blank lines for students to put an answer3. Completed Cootie Catcher with Answers4. Blank Template for students to create their own Cootie CatcherImportant: If you enjoyed this product, check o
Preview of Graphing Lessons and Activities for Charty Party Game
Graphing Lessons and Activities for Charty Party Game

Created by
Teacher Toy Shop
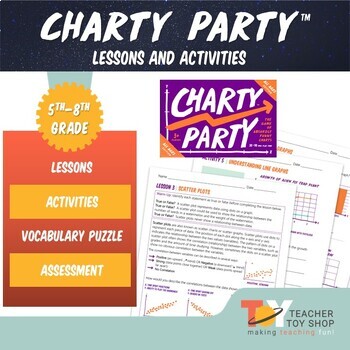
Explore the engaging world of graphing with these Graphing Lessons and Activities for Charty Party Game, featuring nine interactive lessons that seamlessly blend learning with the excitement of a party game. Designed to teach line graphs, bar graphs, scatterplots, and more, these lessons are presented in kid-friendly language, making graphing concepts accessible and enjoyable for students. As they analyze graphs during the Charty Party™ game, students not only practice graphing but also delve in
Preview of Middle School/Upper Elementary Scientific Method and STEM Fair Unit
Middle School/Upper Elementary Scientific Method and STEM Fair Unit

Created by
Casey Sylvain
This unit was designed as a way to incorporate STEM into a more traditional Science Fair model with connections to STEM careers. Students are encouraged to choose a topic that they are deeply interested in and they learn how to connect scientific thinking to concepts outside of science class. They are also introduced to future STEM careers and community resources. The unit is directly aligned to Next Generation Science Standards (NGSS) and the Common Core. In order to help students achieve t
Preview of What's the Verdict: Sharks vs. Lightning? Modes of Center, Spread, and More!
What's the Verdict: Sharks vs. Lightning? Modes of Center, Spread, and More!

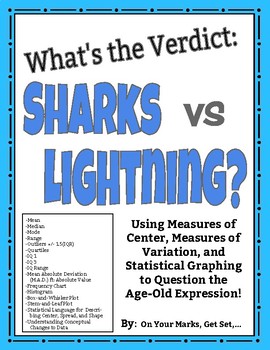
Put it to the test! Use the age-old expression: "You are more likely to get struck by lightning than to be bitten by a shark!" to learn and practice Measures of Center, Measures of Spread, Measures of Shape, and Statistical Graphing including:MEANMEDIANMODERANGEOUTLIERS [Using IQR +/- 1.5(IQR)]QUARTILES [lower quartile (IQ-1) and upper quartile (IQ-3)]INTERQUARTILE RANGE (IQR)MEAN ABSOLUTE DEVIATION/ M.A.D. ft. ABSOLUTE VALUESYMMETRY/ASYMMETRY OF DISTRIBUTIONCLUSTERS AND GAPSBELL SHAPED CURVE AN
Preview of Skittle Radiometric Decay Half-life Lab
Skittle Radiometric Decay Half-life Lab

Created by
3D-PT
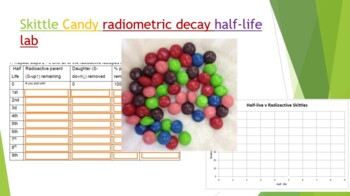
Did you know you can use Skittles candy to demonstrate absolute dating and radiometric decay! Buy a 1-4 lb bag at your local bulk warehouse store for savings. This lab is a great way to show how isotopes decay by shaking a plate full of random skittles. Students use Skittles to observe "Isotopes" decay over each half life. At the end of the lab (and only IF they have done all their work) they can enjoy their "daughter products". Skittles were used because they are durable, hypoallergenic, and th
Preview of Catapult STEM Activity using the Engineering Design Process and Analyzing Means
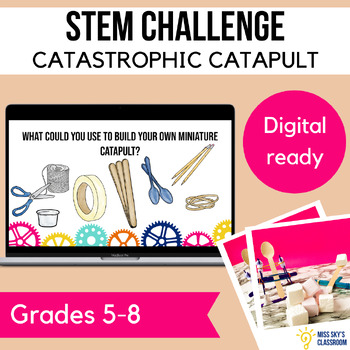
Catapult STEM Activity using the Engineering Design Process and Analyzing Means

This STEM challenge is an excellent engineering activity for middle school students to practice using the engineering design process. Students will engage in hands-on, project based learning that enables them to make real world connections. As a teacher, you will love the low prep activity and detailed teacher guide including differentiation ideas and suggested responses. In this 90 minute STEM Activity, students will work in groups to create a catapult that can launch a projectile as far as pos
Preview of Scientific Method Activity Practice Data Analysis Qualitative and Quantitative
Scientific Method Activity Practice Data Analysis Qualitative and Quantitative

This activity has students collect QUALITATIVE and QUANTITATIVE DATA about the candy in a mixed pack, such as Skittles or M&Ms. There are many candy activities out there, but none quite covered the quantitative and qualitative skills I wanted my middle school students to practice, so I designed my own! This lab is designed to be simple so that students can master beginner lab and data collection skills.In this activity, students will:READ an article about the differences between qualitativ
Preview of Greece Geography 6th Grade Statistics Box Plot Histogram Mean Median Activity

Greece Geography 6th Grade Statistics Box Plot Histogram Mean Median Activity

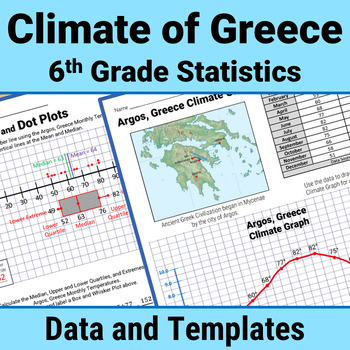
Enrich your study of Ancient Greece using 6th Grade stats skills to analyze Greek climate data. Calculate Measures of Central Tendency (mean, median, mode, range) and Mean Absolute Deviation. Master Data Display with Box and Whisker Plots, Histograms, Dot Plots, Stem and Leaf Charts. Write Statistical Questions. Analyze Data Distribution and Data Variability.All with climate data (temperature and precipitation) from Greece!This Print and Go STEM/STEAM PBL resource includes 70+ pages of climate d
Preview of Preventing The Spread of Zombie Germs!
Preventing The Spread of Zombie Germs!

Created by
Ruddy4Learning
Students in grades 5 through 8 can actually measure the effectiveness of hand washing in a scientifically controlled way. Students identify variables, complete data tables, graph results and analyze their data. Teachers will need access to a black light and a small drop of glow in the dark paint. Kids really enjoy this activity and it utilizes many Common Core skills.
Preview of Paper Plane STEM Activity using Engineering Design Process & Analyzing Means
Paper Plane STEM Activity using Engineering Design Process & Analyzing Means

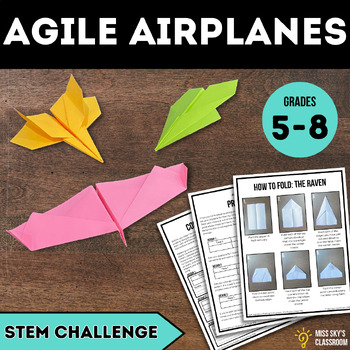
This paper plane STEM challenge is an excellent engineering activity for middle school students to practice using the engineering design process. Students will engage in hands-on, project-based learning that enables them to make real world connections. As a teacher, you will love the low prep activity and detailed teacher guide including differentiation ideas and suggested responses. In this 90 minute STEM Activity, students will work in groups to test and analyze existing paper plane designs be
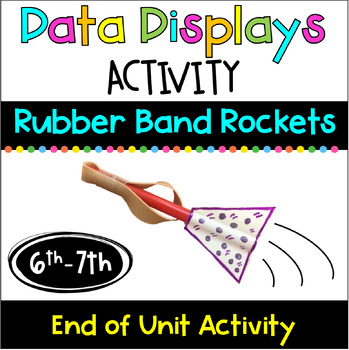
Preview of Data Displays Rubber Band Rocket Activity: Box Plot, Histogram, Distributions
Data Displays Rubber Band Rocket Activity: Box Plot, Histogram, Distributions

Created by
The Math Boss
Make math meaningful to your students with this hands on Data Display Activity! This is a great end of unit, STEM activity that gives real world application to math. Your students will LOVE building and launching their own rockets to collect data that they will display.Objective: Students will construct and launch a rubber band rocket. They will then analyze their data by finding the mean, median, mode, range, & IQR of their results. Student data will be displayed with a box plot & hist
Preview of China Geography 6th Grade Statistics Box Plot Histogram Mean Median Activity
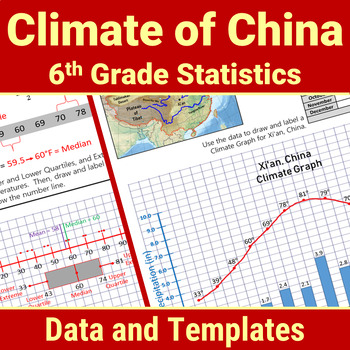
China Geography 6th Grade Statistics Box Plot Histogram Mean Median Activity

Enrich your study of Ancient China using 6th Grade statistics and Probability skills to analyze China climate data. Calculate Measures of Central Tendency (mean, median, mode, range) and Mean Absolute Deviation. Master Data Display with Box and Whisker Plots, Histograms, Dot Plots, Stem and Leaf Charts. Write Statistical Questions. Analyze Data Distribution and Data Variability.All with climate data (temperature and precipitation) from China!This Print and Go STEM/STEAM PBL resource includes 70
Preview of Hurricanes, Fractions to Percents, Statistics, Graphing: Katrina & Co. Tasks 1-5
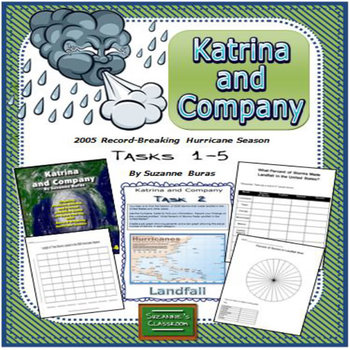
Hurricanes, Fractions to Percents, Statistics, Graphing: Katrina & Co. Tasks 1-5

These statistic tasks related to hurricanes are perfect for math centers, individual or partner work. Katrina and Company, Tasks 1-5, consists of 5 activities dealing with analyzing data related to the 2005 Record-Breaking Hurricane Season of 27 named storms. Students use charts to record information on 4 questions: (1) What percent of storms were in each category? (2) What percent of storms made landfall in the U.S.? (3) What percent of storms lasted the longest? and (4) What percent of storms
Preview of Snowball Catapult: A Winter STEM Activity
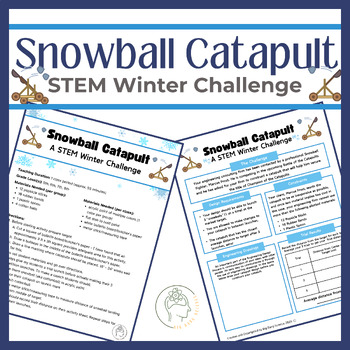
Snowball Catapult: A Winter STEM Activity

Using common classroom materials, this Winter STEM Challenge provides students an engaging opportunity to apply their knowledge, think critically, collaborate with peers, and develop hands-on engineering skills using simple materials. It also adds an element of excitement and friendly competition to promote engagement and enthusiasm in the classroom.
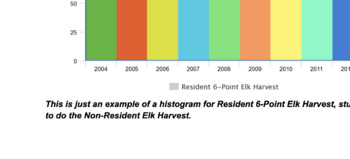
Preview of Amplify Science/Math Natural Selection: Elk Histograms and Data Interpretation
Amplify Science/Math Natural Selection: Elk Histograms and Data Interpretation

Created by
Michael Thomas
This worksheet will work well for students who are part-way through the Natural Selection Unit of Amplify, or students who need some practice interpreting data and representing it in histograms or bar graphs. This would also work well for a day where you had a sub. Students will be asked to find answers to questions by looking at data as well as determine if there are any patterns in the data. They will also realize that different forms of data representation lends itself to finding patterns mo
Preview of Mesopotamia Geography 6th Grade Statistics Box Plot Mean Median Mode Activity
Mesopotamia Geography 6th Grade Statistics Box Plot Mean Median Mode Activity

Enrich your study of Mesopotamia using 6th Grade stats skills to analyze Mesopotamian climate data. Calculate Measures of Central Tendency (mean, median, mode, range) and Mean Absolute Deviation. Master Data Display with Box and Whisker Plots, Histograms, Dot Plots, Stem and Leaf Charts. Write Statistical Questions. Analyze Data Distribution and Data Variability.All with climate data (temperature and precipitation) from Iraq and Turkey!This Print and Go STEM/STEAM resource includes 70+ pages of
Preview of Mesopotamia Geography 6th Grade Statistics Mean Median Mode Box Plot Activity
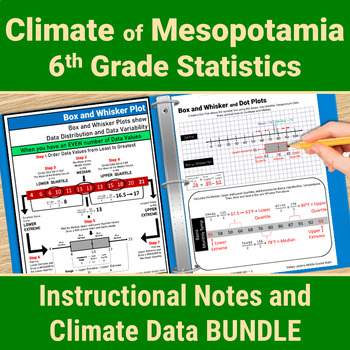
Mesopotamia Geography 6th Grade Statistics Mean Median Mode Box Plot Activity

Enrich your study of Mesopotamia using 6th Grade stats skills to analyze Mesopotamian climate data. Master Data Display with Box and Whisker Plots, Histograms, Dot Plots, Stem and Leaf Charts. Calculate Measures of Central Tendency (mean, median, mode, range) and Mean Absolute Deviation. Write Statistical Questions. Analyze Data Distribution and Data Variability.All with climate data (temperature and precipitation) from Iraq and Turkey!This Print and Go STEM/STEAM PBL resource includes 120 pages
Preview of Skittle Statistics MS Excel Mini-Lab

Skittle Statistics MS Excel Mini-Lab

Created by
3D-PT
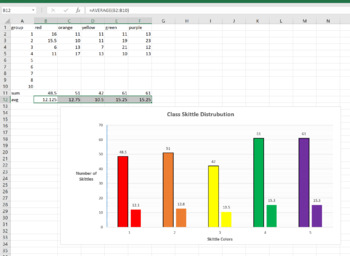
This is a 1 class MS Excel lab for a computer or math class. You can have the students explore the distribution of different color Skittles in class. This is a great mini-lab or half-day activity when you school ends up with a weird schedule day. Tell them they can't eat till the Skittles till the end of class, or they will distort their numbers. Also make sure they don't throw them or shove them up their nose (Yes, stuck Skittles are hard to extract, ask me how I know..)The goal of this lab is
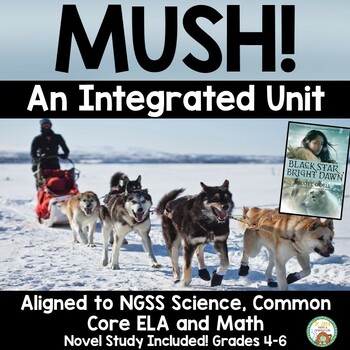
Preview of Mush! Integrated Unit with Black Star, Bright Dawn Novel Study
Mush! Integrated Unit with Black Star, Bright Dawn Novel Study

This fully integrated unit centers on Scott O'Dell's award winning novel, Black Star, Bright Dawn. The novel tells the story of a young lady who runs in one of the most challenging dog sled races in the world. Using the novel as the focus, standards-aligned Science, Math, Social Studies, Art, and Engineering are all interwoven into this engaging unit. The novel study includes character pages, vocabulary, and comprehension pages with answer keys. Science activities include a blubber investigat
Preview of Lluvia de Colores (Actividad para aplicar método científico)_Español
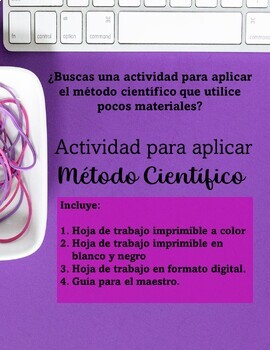
Lluvia de Colores (Actividad para aplicar método científico)_Español

Created by
Neuro-Answer
En ocasiones necesitas una actividad que no utilice muchos materiales y que no genere un ambiente formal como lo es la experiencia de laboratorio. Esta actividad fue pensada en lograr esto y que a la vez los estudiantes apliquen el método científico. Incluye: 1.Hoja de trabajo imprimible a color PDF2.Hoja de trabajo imprimible en blanco y negro PDF3.Hoja de trabajo en formato digital PPT4.Guía para el maestro PDF y PPTPuedes complementar esta actividad con los recursos del método científico di
Preview of Rome Geography 6th Grade Statistics Box Plot Histogram Mean Median Mode Activity

Rome Geography 6th Grade Statistics Box Plot Histogram Mean Median Mode Activity

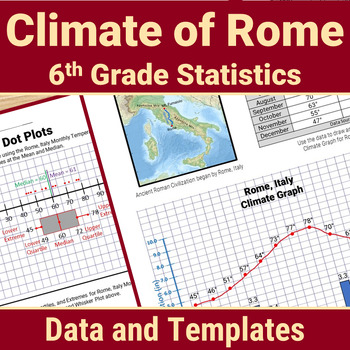
Enrich your study of Ancient Rome using 6th Grade stats skills to analyze Italy climate data. Calculate Measures of Central Tendency (mean, median, mode, range) and Mean Absolute Deviation. Master Data Display with Box and Whisker Plots, Histograms, Dot Plots, Stem and Leaf Charts. Write Statistical Questions. Analyze Data Distribution and Data Variability.All with climate data (temperature and precipitation) from Rome!This Print and Go STEM/STEAM PBL resource includes 70+ pages of climate data
Showing 1-24 of 57 results

Find Science resources | TPT

Importance of learning science

Learning science is particularly important for students as it equips them with the essential knowledge and skills to make sense of the world around them. Science education is not just about memorizing facts. It fosters critical thinking, inquiry, and problem-solving abilities. These skills are not only useful in school but also in everyday life beyond the classroom.

Benefits of learning science

Learning science offers many benefits to students both in school and beyond. In fact, it helps students:

  • Question the world around them and seek evidence-based explanations
  • Cultivate their ability to observe, experiment, and analyze data
  • Nurture a sense of curiosity, awe, and wonder about the natural world
  • Understand natural phenomena and the laws that govern the universe

With a solid foundation in science, teachers can help empower students to think critically, solve problems, make informed decisions, and engage with the world around them in meaningful ways.

Teaching with science resources

One of the best parts about science class is all of the possibilities for hands-on, collaborative learning! Think: labs, experiments, inquiry-based activities, and design challenges. These activities encourage students to explore scientific concepts by observing, asking questions, and conducting investigations. Additionally, with small group centers, students can engage in group experiments, discussions, and projects that require them to collaborate, share ideas, and solve problems together.

Discover printable and digital science resources

If you’re a teacher or parent looking for printable or digital science resources, TPT has an extensive array of instructional materials for every learning need, topic, or grade level. Whether you're learning about plant parts or butterfly life cycles, or exploring advanced topics like the anatomy of a cell or Newton’s laws of motion, we've got you covered.

On TPT, science resources come in various forms: from labs and worksheets to craftivities and doodle notes. They can be used to enhance learning, assess a student’s mastery of science concepts, or to reteach a tricky topic. With plenty of TPT resources at your fingertips, teaching and learning science will be so much easier. Plus, you can expand students’ knowledge even further by exploring TPT math resources, which are frequently paired with science lessons.

Frequently asked questions about teaching science

What types of science lessons are available on TPT?

There are many different types of science resources sold by Sellers on TPT. Some popular science lessons include biology, earth sciences, chemistry, environment, engineering, and anatomy.

How do I find science lessons on TPT?

Educators can save time preparing science lessons with resources created by experienced teachers. Simply start a search for science resources on the TPT marketplace, and filter by grade level, price, and/or resource type to find materials that've been proven to work in classrooms like yours. No matter what you’re teaching, there are plenty of science lessons and activities sold by Sellers on TPT that are tailored to meet your students' skill levels.

How can I make my science lessons fun and engaging?

Students learn best when they're engaged! Sprinkle a little fun into your science lessons and make them feel like real scientists by investigating everyday objects, exploring the world outside the classroom, and doing hands-on and collaborative experiments and design challenges.