TPT
Total:
$0.00

Subjects

Arts & Music
English Language Arts
Foreign Language
Holidays/Seasonal
Math
Science
Social Studies - History
Specialty
For All Subject Areas
25 results

Social studies Common Core 6.SP.B.5c resources
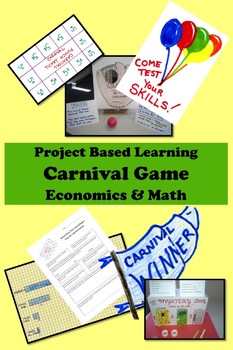
Preview of Carnival Game Economics PBL Project-Based Learning GATE
Carnival Game Economics PBL Project-Based Learning GATE

Smaller tasks add up to big, big learning with this gold medal standard project-based learning activity! What a sneaky cool way to learn math, economics, and functional design! (Insert evil teacher laugh.) It’s a hands-on approach to Common Core Standards. In Carnival Game Economics, students design a carnival skill game and gather data as junior market researchers during the test phase. They’ll use this data to help make decisions. After making calculations for probability, students will
Preview of Greece Geography 6th Grade Statistics Box Plot Histogram Mean Median Activity
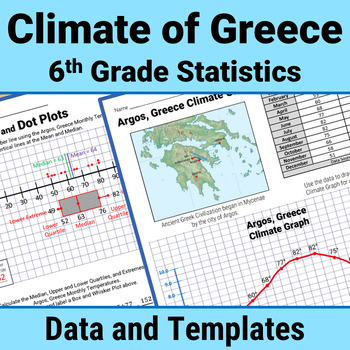
Greece Geography 6th Grade Statistics Box Plot Histogram Mean Median Activity

Enrich your study of Ancient Greece using 6th Grade stats skills to analyze Greek climate data. Calculate Measures of Central Tendency (mean, median, mode, range) and Mean Absolute Deviation. Master Data Display with Box and Whisker Plots, Histograms, Dot Plots, Stem and Leaf Charts. Write Statistical Questions. Analyze Data Distribution and Data Variability.All with climate data (temperature and precipitation) from Greece!This Print and Go STEM/STEAM PBL resource includes 70+ pages of climate d
Preview of Stock Market Simulation Challenge I Digital Learning
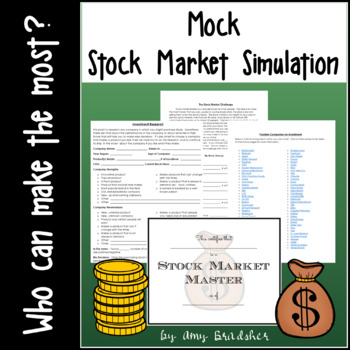
Stock Market Simulation Challenge I Digital Learning

What better way to understand how the stock market works than to simulate it in your classroom? To make it a competitive project! This simulation contains the project worksheets, hyperlinks, research guides, and graphs needed for your students to "purchase" their own stock and track it's value over time. This project was written to accompany Gary Paulsen's book "Lawn Boy," but it can be used with or without this book.These activities are suitable for upper-elementary and middle grade students
Preview of Presidents' Day Math - Real World Mean, Median, Mode, and Percentage
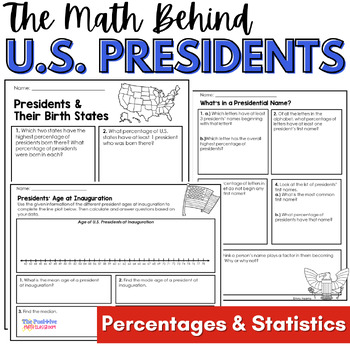
Presidents' Day Math - Real World Mean, Median, Mode, and Percentage

Engage your middle school students with these digital and printable activities perfect for Presidents' Day or anytime you are looking for a cross-curricular math resource. Not only will your students practice skills that include analyzing data, calculating mean, median, mode, and percentages, but they will also see how numbers can be used in the real world. They may even learn a few new facts about the U.S. presidents! Each resource below is included as a printable pdf and a version used with G
Preview of 6th Grade Statistics Project Activity with Climate Data from 6 Ancient Cultures
6th Grade Statistics Project Activity with Climate Data from 6 Ancient Cultures

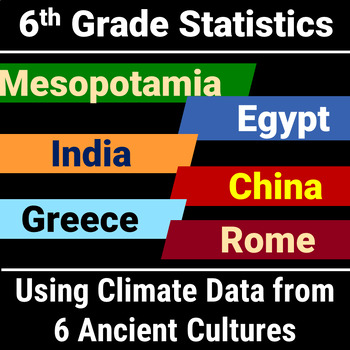
Enrich your study of ancient cultures using 6th Grade Statistics and Probability skills to analyze climate data. Calculate Measures of Central Tendency (mean, median, mode, range) and Mean Absolute Deviation. Master Box and Whisker Plots, Histograms, Dot Plots, Stem and Leaf Charts. Write Statistical Questions. Analyze Data Distribution and Data Variability. Apply climate analysis to ancient settlement patterns Answer the "how will I use this math" question!If you only teach Mesopotamia, Egypt,
Preview of Egypt Geography 6th Grade Statistics Mean Median Mode Range Box Plot Activity
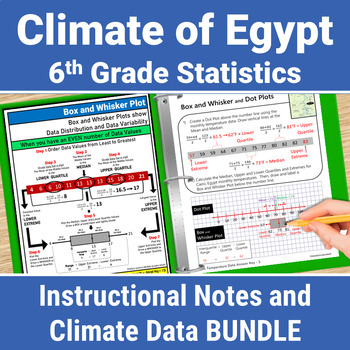
Egypt Geography 6th Grade Statistics Mean Median Mode Range Box Plot Activity

Enrich your study of Ancient Egypt using 6th Grade stats skills to analyze Egypt climate data. Master Data Display with Box and Whisker Plots Activity, Histograms, Dot Plots, Stem and Leaf Charts. Calculate Measures of Central Tendency (mean, median, mode, range) and Mean Absolute Deviation. Write Statistical Questions. Analyze Data Distribution and Data Variability.All with climate data (temperature and precipitation) from Egypt!This Print and Go STEM/STEAM PBL resource includes 120 pages of In
Preview of India Geography 6th Grade Statistics Box Plot Histogram Mean Median Activity
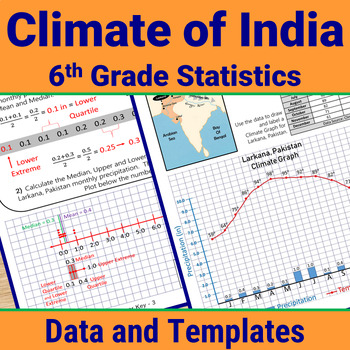
India Geography 6th Grade Statistics Box Plot Histogram Mean Median Activity

Enrich your study of India using 6th Grade stats skills to analyze India climate data. Calculate Measures of Central Tendency (mean, median, mode, range) and Mean Absolute Deviation. Master Data Display with Box and Whisker Plots, Histograms, Dot Plots, Stem and Leaf Charts. Write Statistical Questions. Analyze Data Distribution and Data Variability.All with climate data (temperature and precipitation) from ancient Indian sites!This Print and Go STEM/STEAM PBL resource includes 70+ pages of clim
Preview of Egypt Geography 6th Grade Statistics Box Plot Histogram Mean Median Activity

Egypt Geography 6th Grade Statistics Box Plot Histogram Mean Median Activity
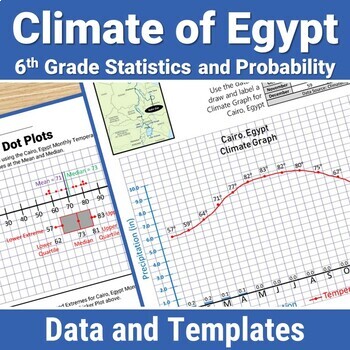
Enrich your study of Ancient Egypt using 6th Grade stats skills to analyze Egypt climate data. Calculate Measures of Central Tendency (mean, median, mode, range) and Mean Absolute Deviation. Master Data Display with Box and Whisker Plots, Histograms, Dot Plots, Stem and Leaf Charts. Write Statistical Questions. Analyze Data Distribution and Data Variability.All with climate data (temperature and precipitation) from Egypt!This Print and Go STEM/STEAM PBL resource includes 70+ pages of climate dat
Preview of China Geography 6th Grade Statistics Box Plot Histogram Mean Median Activity

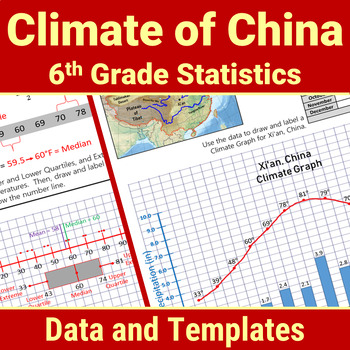
China Geography 6th Grade Statistics Box Plot Histogram Mean Median Activity
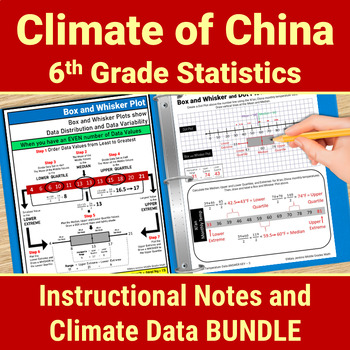
Enrich your study of Ancient China using 6th Grade statistics and Probability skills to analyze China climate data. Calculate Measures of Central Tendency (mean, median, mode, range) and Mean Absolute Deviation. Master Data Display with Box and Whisker Plots, Histograms, Dot Plots, Stem and Leaf Charts. Write Statistical Questions. Analyze Data Distribution and Data Variability.All with climate data (temperature and precipitation) from China!This Print and Go STEM/STEAM PBL resource includes 70
Preview of 6th Grade Statistics Project Activity with Climate Data from 4 Ancient Cultures
6th Grade Statistics Project Activity with Climate Data from 4 Ancient Cultures

Enrich your geography study of ancient cultures using 6th Grade Statistics and Probability skills to analyze climate data. Calculate Measures of Central Tendency (mean, median, mode, range) and Mean Absolute Deviation. Master Box and Whisker Plots, Histograms, Dot Plots, Stem and Leaf Charts. Write Statistical Questions. Analyze Data Distribution and Data Variability. Apply climate analysis to ancient settlement patternsAnswer the "how will I use this math" question!If you also teach Greece and
Preview of China Geography 6th Grade Statistics Mean Median Mode Range Box Plot Activity
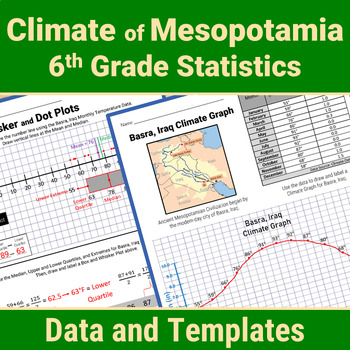
China Geography 6th Grade Statistics Mean Median Mode Range Box Plot Activity

Enrich your study of Ancient China using 6th Grade stats skills to analyze China climate data. Master Data Display with Box and Whisker Plots, Histograms, Dot Plots, Stem and Leaf Charts. Calculate Measures of Central Tendency (mean, median, mode, range) and Mean Absolute Deviation. Write Statistical Questions. Analyze Data Distribution and Data Variability.All with climate data (temperature and precipitation) from China!This Print and Go STEM/STEAM PBL resource includes 120 pages of Instruction
Preview of Mesopotamia Geography 6th Grade Statistics Box Plot Mean Median Mode Activity
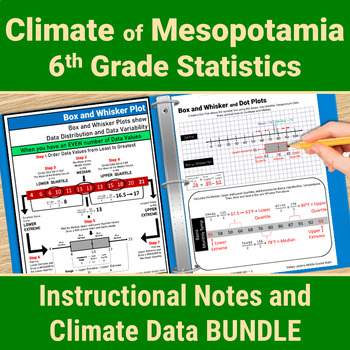
Mesopotamia Geography 6th Grade Statistics Box Plot Mean Median Mode Activity

Enrich your study of Mesopotamia using 6th Grade stats skills to analyze Mesopotamian climate data. Calculate Measures of Central Tendency (mean, median, mode, range) and Mean Absolute Deviation. Master Data Display with Box and Whisker Plots, Histograms, Dot Plots, Stem and Leaf Charts. Write Statistical Questions. Analyze Data Distribution and Data Variability.All with climate data (temperature and precipitation) from Iraq and Turkey!This Print and Go STEM/STEAM resource includes 70+ pages of
Preview of Mesopotamia Geography 6th Grade Statistics Mean Median Mode Box Plot Activity
Mesopotamia Geography 6th Grade Statistics Mean Median Mode Box Plot Activity

Enrich your study of Mesopotamia using 6th Grade stats skills to analyze Mesopotamian climate data. Master Data Display with Box and Whisker Plots, Histograms, Dot Plots, Stem and Leaf Charts. Calculate Measures of Central Tendency (mean, median, mode, range) and Mean Absolute Deviation. Write Statistical Questions. Analyze Data Distribution and Data Variability.All with climate data (temperature and precipitation) from Iraq and Turkey!This Print and Go STEM/STEAM PBL resource includes 120 pages
Preview of Middle School Survey Statistics Project Bundle
Middle School Survey Statistics Project Bundle

DescriptionA bundle of all materials needed for my Middle School Survey Project! Perfect for an end of year or statistics unit project.A fun, engaging, and active way for students to explore the foundations of statistical analysis and modeling.In this project students are tasked with creating a statistical question, surveying two relevant populations, calculating the measures of center and variability, making a dot plot, histogram, and box-and-whisker plot, and analyzing their data.Included in t
Preview of Math & History: Black Sports Pioneers - Lesson Plan / Presentation / Worksheet
Math & History: Black Sports Pioneers - Lesson Plan / Presentation / Worksheet

Created by
Mr Drews Store
Keywords: Black History Month, Math, Social Studies, Sports, Athletes, Jackie Robinson, Baseball, Football, Basketball, Olympics, African American, Multiplication, Division, Fractions, Percent, Statistics, Google ClassroomCelebrate Black History Month with an engaging lesson plan that blends math with the inspiring stories of seven trailblazing sports athletes! This resource, designed for grades 5-8 math and easily adaptable for social studies, is packed with activities to captivate your student
Preview of Rome Geography 6th Grade Statistics Box Plot Histogram Mean Median Mode Activity
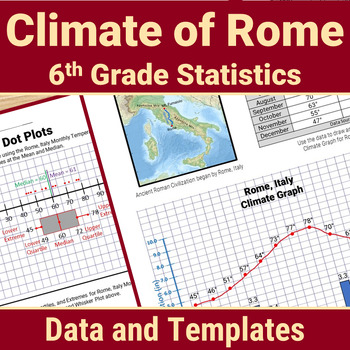
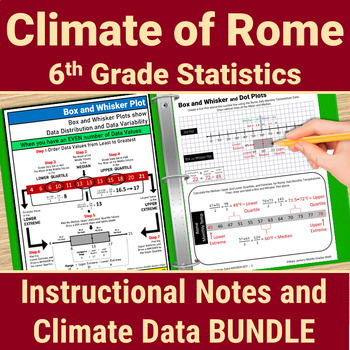
Rome Geography 6th Grade Statistics Box Plot Histogram Mean Median Mode Activity

Enrich your study of Ancient Rome using 6th Grade stats skills to analyze Italy climate data. Calculate Measures of Central Tendency (mean, median, mode, range) and Mean Absolute Deviation. Master Data Display with Box and Whisker Plots, Histograms, Dot Plots, Stem and Leaf Charts. Write Statistical Questions. Analyze Data Distribution and Data Variability.All with climate data (temperature and precipitation) from Rome!This Print and Go STEM/STEAM PBL resource includes 70+ pages of climate data
Preview of Greece Geography 6th Grade Statistics Mean Median Mode Range Box Plot Activity
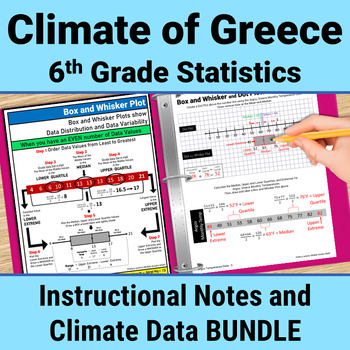
Greece Geography 6th Grade Statistics Mean Median Mode Range Box Plot Activity

Enrich your study of Ancient Greece using 6th Grade statistics skills to analyze Greek climate data. Master Data Display with Box and Whisker Plots, Histograms, Dot Plots, Stem and Leaf Charts. Calculate Measures of Central Tendency (mean, median, mode, range) and Mean Absolute Deviation. Write Statistical Questions. Analyze Data Distribution and Data Variability.All with climate data (temperature and precipitation) from Greece!This Print and Go STEM/STEAM PBL resource includes 120 pages of Inst
Preview of Rome Geography 6th Grade Statistics Mean Median Mode Box Plot Histogram Activity
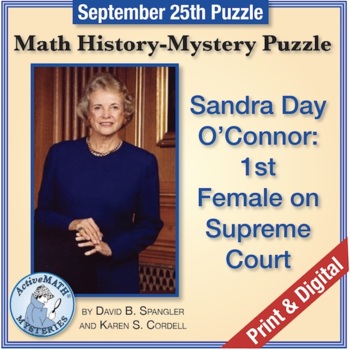
Rome Geography 6th Grade Statistics Mean Median Mode Box Plot Histogram Activity

Enrich your study of Ancient Rome using 6th Grade Statistics and Probability skills to analyze Italy climate data. Master Data Display with Box and Whisker Plots, Histograms, Dot Plots, Stem and Leaf Charts. Calculate Measures of Central Tendency (mean, median, mode, range) and Mean Absolute Deviation. Write Statistical Questions. Analyze Data Distribution and Data Variability.All with climate data (temperature and precipitation) from Rome!This Print and Go STEM/STEAM PBL resource includes 120 p
Preview of Sept. 25 Math & Supreme Court Puzzle: Sandra Day O’Connor | Daily Mixed Review
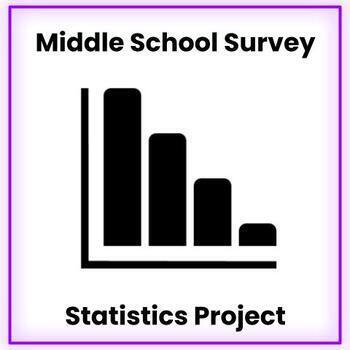
Sept. 25 Math & Supreme Court Puzzle: Sandra Day O’Connor | Daily Mixed Review

On September 25 of the Mystery Year, Sandra Day O'Conner was sworn in as the first woman justice of the Supreme Court. As students solve clues to find the year, they review percent, mean when given the total and the number of scores, proportions, and reasoning skills. This puzzle provides engaging review of middle school math topics. Your PDF download includes:2-page digital version with horizontal layout, prepped for Easel 1-page printable version3 pages of Teacher Notes including step-by-step
Preview of Middle School Survey Statistics Project
Middle School Survey Statistics Project

Middle school statistics project!In this project students are tasked with creating a statistical question, surveying two relevant populations, calculating the measures of center and variability, making a dot plot, histogram, and box-and-whisker plot, and analyzing their data. Included in the survey project guidelines are student directions on the following:- How to create a survey- How to model the data- Finding the measures of center and variability - How to analyze their data (through guided
Preview of India Geography 6th Grade Statistics Mean Median Mode Range Box Plot Activity
India Geography 6th Grade Statistics Mean Median Mode Range Box Plot Activity

Enrich your study of India using 6th Grade stats skills to analyze India climate data. Master Data Display with Box and Whisker Plots, Histograms, Dot Plots, Stem and Leaf Charts. Calculate Measures of Central Tendency (mean, median, mode, range) and Mean Absolute Deviation. Write Statistical Questions. Analyze Data Distribution and Data Variability.All with climate data (temperature and precipitation) from ancient Indian sites!This Print and Go STEM/STEAM PBL resource includes 120 pages of Inst
Preview of Olympic National Park Tide Charts: Graphing, Interpreting, and Decimals
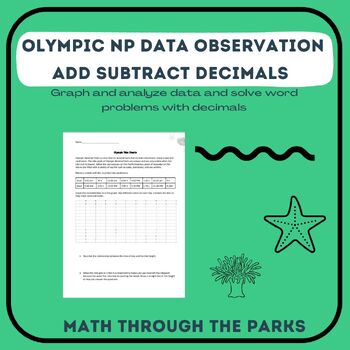
Olympic National Park Tide Charts: Graphing, Interpreting, and Decimals

Olympic National Park has daily predicted tide charts for their beaches. The goal of this activity is to graph the data and make predictions based on the graph. Questions incorporate understand of time, adding and subtracting decimals, and even averages. There is also a create your own question part of for this activity where the student can use current data to create questions.
Preview of Milk Matters! Discovering Dairy

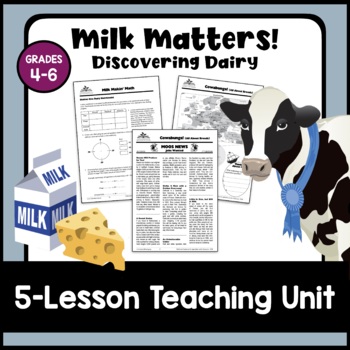
Milk Matters! Discovering Dairy

Created by
Learn About Ag
This unit contains five lessons designed to teach students about the history, production, nutritional value and economic significance of California’s dairy industry. Students will gain knowledge in social science, mathematics, language arts, science, visual arts and physical education as they learn about the process through which dairy products are produced and transported from cow to consumer. Students will gain a deeper understanding and appreciation for agriculture’s role in their daily lives
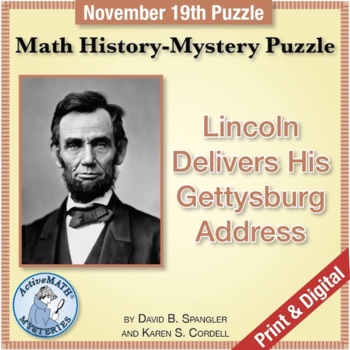
Preview of Nov. 19 Math & History Puzzle: President Lincoln's Gettysburg Address | Review

Nov. 19 Math & History Puzzle: President Lincoln's Gettysburg Address | Review

November 19 of the Mystery Year was the date of Lincoln's Gettysburg Address. Math clues for finding the year include mean, measurement conversions, unit rate, proportions, and reasoning skills. Math History-Mystery Puzzles for Middle School are research-based and are great real-world motivators for students in 6th grade or higher to use any time. Your PDF download includes:2-page digital version with horizontal layout, prepped for Easel 1-page printable version3 pages of Teacher Notes including
Showing 1-24 of 25 results

Find Social Studies - History resources | TPT

Importance of learning social studies

Social studies offers valuable insights into history, geography, and much more. Social studies captivates students by providing them with perspectives from the past, present, and future, allowing them to understand history and navigate current events. It enables them to appreciate how previous generations have shaped their present reality. In essence, social studies opens their eyes to the vastness of life beyond their immediate surroundings.

Benefits of learning social studies

Learning social studies offers many benefits to students in terms of helping them develop a holistic understanding of the world. Namely, it helps them:

  • Learn about the achievements, challenges, perspectives, traditions, and customs of different societies
  • Evaluate information, analyze evidence, and make informed judgments about complex social, economic, and political issues
  • Become active, responsible, and engaged citizens
  • Comprehend global issues such as human rights, environmental sustainability, and economic disparities

By teaching social studies, teachers can help students develop critical thinking skills, foster civic engagement, and promote social awareness and responsibility.

Teaching with social studies resources

On TPT, social studies resources come in various formats, from worksheets to interactive notebooks to units. They can be used to enhance learning, assess a student’s mastery of social studies concepts, or to reteach a tricky topic. With plenty of TPT resources at your fingertips, teaching and learning social studies will be so much easier.

Discover printable and digital social studies resources

If you’re a teacher or parent looking for printable or digital social studies resources, TPT has an extensive array of instructional materials for every learning need, topic, or grade level. Whether you’re teaching students about America’s democratic process, the legacy of Dr. Martin Luther King, Jr., how to read maps, or World War II, we’ve got you covered.

Social studies resources on TPT offer informative lessons, engaging texts, intriguing facts, interactive puzzles, and enjoyable trivia games. These grade-specific resources ensure that all students can access age-appropriate materials that stimulate their minds and enhance their creative thinking abilities.

For instance, first graders can explore worksheets on senses and emotions, followed by a coloring page featuring Harriet Tubman. Older students can test their knowledge with quizzes on statistics and capital cities, then delve into the history of the Underground Railroad through an informational sheet or enjoy a word search focused on civil rights leaders. With such a wide variety of subjects and topics covered, our social studies pages provide endless opportunities for students to explore the world in captivating ways.

Frequently asked questions about teaching social studies

What types of social studies lessons are available on TPT?

There are many different types of history resources sold by Sellers on TPT. Some popular social studies lessons include U.S. history, world history, ancient history, geography, civics, and government.

How do I find social studies lessons on TPT?

Educators can save time preparing history lessons with resources created by experienced teachers. Simply start a search for social studies resources on the TPT marketplace, and filter by grade level, price, and/or resource type to find materials that've been proven to work in classrooms like yours. No matter what you’re teaching, there are plenty of social studies lessons and activities sold by Sellers on TPT that are tailored to meet your students' skill levels.