98 results
Algebra Common Core HSS-ID.A.4 resources
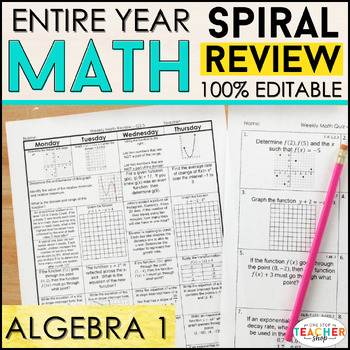
Algebra 1 Spiral Review | Homework, Algebra 1 Warm Ups, Progress Monitoring
This Algebra 1 spiral review & quiz resource can easily be used as HOMEWORK, WARM-UPS, or a DAILY MATH REVIEW! This resource was designed to keep math concepts fresh all year and to help you easily track student progress. All pages are 100% EDITABLE and easy to differentiate to fit your students' needs.⭐⭐UPGRADE for just $10 and get both PRINT & DIGITAL versions } CLICK HERE✪ CLICK HERE to see more SUBJECTS & GRADE LEVELS!★★SAVE $$ with these BUNDLES★★Algebra 1 Bundle: Spiral Review,
Subjects:
Grades:
8th - 10th
Types:
CCSS:
Standard Deviation Worksheet
Hello Math Teachers! Enhance your students' understanding of standard deviation, mean, range, and variance with this comprehensive worksheet on calculating standard deviation!This two-sided worksheet includes scaffolded questions to help students begin and interpret similarities and differences using real-world situations. It's perfect for Algebra 1 classes as homework or as a classwork activity, and would be a great addition to any statistics and data analysis unit.This worksheet comes with an
Subjects:
Grades:
10th
Types:
CCSS:
Also included in: Data and Statistics Worksheets Bundle

Algebra 1 Google Forms Semester 2 Digital and Printable Homework Bundle
This bundle includes all SEMESTER 2 Algebra 1 editable Google Forms homework assignments, quizzes, and tests that I have created. Every assignment also includes a "worksheet" that corresponds with the questions on each form. Just assign digitally or print + go!Not 1:1? Not using Google Classroom, yet? All of these assignments also come with a stand-alone "worksheet" that may be used with or instead of the digital resource. The SEMESTER 2 BUNDLE includes concepts within the following units:
Subjects:
Grades:
8th - 11th
Types:
CCSS:
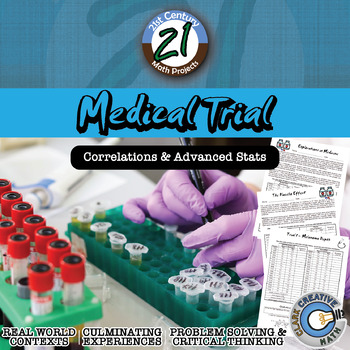
Medical Trial -- Statistics & T-Test - 21st Century Math Project
Bring your students into the world of double blind medical studies. Every day, doctors and hospitals rely on scientific studies and research to make healthcare decisions for patients. Are some medicines more effective than others? Do certain types of patients benefit more from certain types of treatments? Due to the security of medical records, studies are somewhat limited in their scope and are generally carried out at universities and research hospitals. At these facilities ground breaking wo
Subjects:
Grades:
8th - 12th
Types:
CCSS:
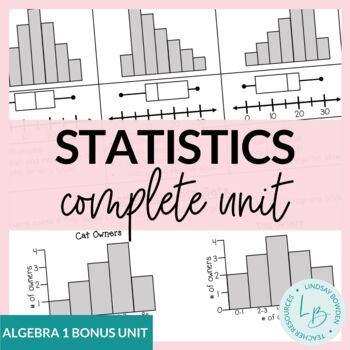
Statistics Unit Bundle
This is a complete statistics unit for an Algebra 1 course. All assessments (quizzes, study guide, and test) are editable to fit your needs. This unit is included in my Algebra 1 Curriculum.*Note: This unit is best suited for on-level or lower-level/special education math classes. Supplements will most likely be needed for an honors or upper-level math class.*This unit now contains video lessons for every lesson!*Topics Covered:Mean, Median, Mode ReviewStem and Leaf PlotsHistogramsDot PlotsRange
Subjects:
Grades:
8th - 10th
CCSS:
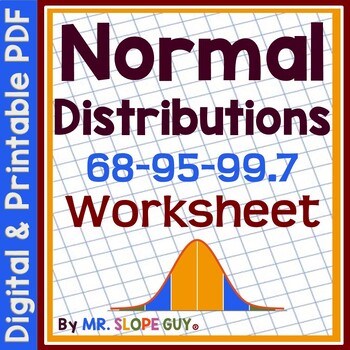
Normal Distributions Empirical Rule Worksheet
Hello Math Teachers! Do you want to help your students understand normal distributions and apply the Empirical Rule (64-95-99.7)? This worksheet can help! Students will practice interpreting real-world examples to find percentages, probability, and estimate data statements from distributions. They will also label parts of normal distributions when given mean and standard deviation, and identify key data points from the graphical distribution of data.This two-sided worksheet comes with an easy-to
Subjects:
Grades:
10th
Types:
CCSS:
Also included in: Data and Statistics Worksheets Bundle

Algebra 1 Curriculum
Get a complete High School Algebra 1 curriculum including units on solving equations and inequalities, linear functions, exponents and exponential functions, factoring polynomials, quadratics, and more! These ready-to-use Algebra 1 resources include everything you need to teach high school algebra to your on-level or lower-level/special education class. Supplements would be needed for an honors class.Each unit contains guided notes, practice worksheets for the classroom and/or homework, activiti
Grades:
8th - 11th
CCSS:
Data Analysis and Statistics in Algebra 1 Google Forms Homework and Assessment
This Algebra 1 Google Forms bundle currently includes auto-grading assignments on the following skills related to data analysis and statistics:Measures of Central TendencyDot Plots and HistogramsBox PlotsStandard Deviation and The Empirical RuleTwo-Way Frequency TablesScatter PlotsEach assignment also includes a PDF "worksheet" for students to complete along with the form.All of the assignments in this bundle are also included in my:★ Algebra 1 (Semester 2) Google Forms BundleYou may also be int
Subjects:
Grades:
6th - 9th
CCSS:
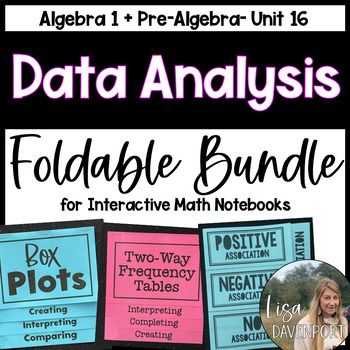
Data Analysis and Statistics Foldable Bundle
This foldable bundle includes skills associated with data and statistics taught within middle school math or algebra 1 standards:Mean, Median, Mode, RangeComparing CentersBox PlotsDot PlotsDisplaying Numerical DataAssociation within Scatter PlotsScatter PlotsWriting an Equation for a Trend LineStandard Deviation + The Empirical RuleData + Statistics in Algebra 1 Overview (Dot Plots, Histograms, Box Plots, + Two-Way Frequency TablesDetailed answer keys are included for each foldable.All of these
Grades:
7th - 10th
CCSS:
High School Data Analysis Project
This project covers a large range of data analysis methods. There are eleven total parts to the project.
Part One: the students have to collect data from 20 students outside of the classroom. Directions specify to ask students from each grade level.
Part Two: Measures of Center and Variation. Students will calculate mean, median, mode, range, and standard deviation for some of the data collected. Definitions of each term are included.
Part Three: Box-And-Whisker Plot. Students will create t
Subjects:
Grades:
9th - 12th
Types:
CCSS:
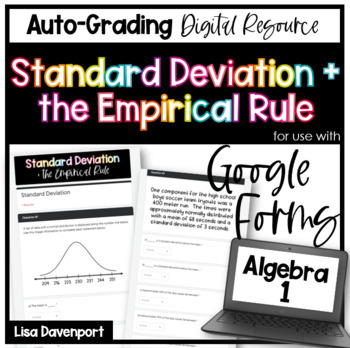
Standard Deviation and the Empirical Rule Google Forms Homework
This 18-question, auto-grading Google Forms assignment provides students with practice applying the concepts of mean, standard deviation, and the empirical rule. Students will be asked to approximate/ calculate percentages of data values, given the mean and the standard deviation.All questions are "drop-down".This assignment is also included in my Algebra 1 (Semester 2) Bundle for Google FormsThis download also includes a PDF "worksheet" with the exact same questions as the Google Form. Just as
Subjects:
Grades:
9th - 12th
Types:
CCSS:
Also included in: Algebra 1 Google Forms Semester 2 Digital and Printable Homework Bundle
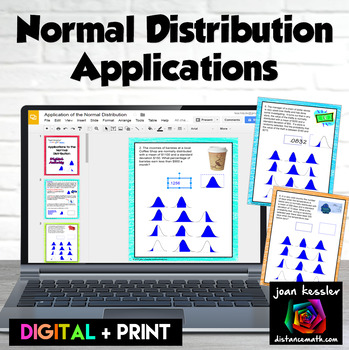
Normal Distribution Applications Digital Activity plus Print
In this digital interactive activity for Applications of the Normal Distribution your students will solve 10 real world applications of the Normal Distribution with GOOGLE® Slides. They will first analyze the problem, then “sketch” the scenario by selecting one of 12 shaded normal distribution diagrams, and then determine the solution either using technology or manually by tables using z-scores.A printable version of the questions is also included. Students will also read, analyze and sketch
Subjects:
Grades:
9th - 12th
Types:
CCSS:
Also included in: Probability and Statistics Algebra 2 Unit 11 Activity Bundle
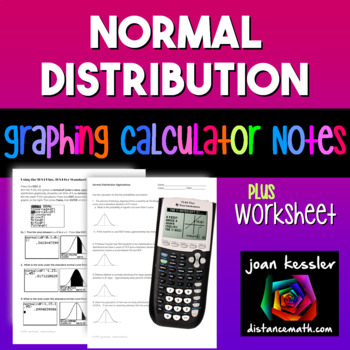
Normal Distribution | TI-84 Calculator Reference Sheet and Practice
With this Normal Distribution concise, step by step handout, your students will learn how to use the TI 83 and TI 84 Graphing Calculators to find probabilities for the Standard Normal Distribution and also find probabilities for Applications to the Standard Normal Distribution. They will also learn how to use the shade feature to construct a graph and have the calculator shade in the appropriate region.These can be used as Binder Notes or printed smaller for Interactive Notebooks.Note: This han
Subjects:
Grades:
9th - 12th
Types:
CCSS:
Mean Absolute Deviation Notes and Worksheets
These mean absolute deviation notes and worksheets are meant for an Algebra 1 statistics unit. They cover:Finding MAD given data, dot plots, and histograms, and bar graphsInterpreting MADSee preview to view all pages! 4 pages + answer keys.You may also like:Box and Whisker Plots Notes & WorksheetsHistograms Notes & WorksheetsTerms of Use:This product should only be used by the teacher who purchased it. This product is not to be shared with other teachers. Please buy the correct number of
Subjects:
Grades:
8th - 10th
CCSS:
Also included in: Statistics Unit Bundle
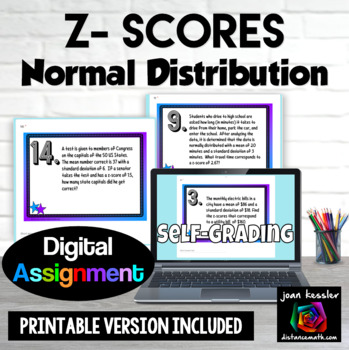
Normal Distribution Z-Scores Digital plus Print
Your students will get extra practice and gain fluency learning about z-scores and the Normal Distribution with both a self-grading digital resource and a PDF printable version. There are 16 applications to solve with a mix of multiple choice and free response including: finding the z-scorefinding the standard deviation knowing the z-score, mean, and data point finding the mean knowing the z-score, data point, and standard deviationinterpreting the z-score. Your download includes:PDF with link
Subjects:
Grades:
9th - 12th
Types:
CCSS:
Also included in: Probability and Statistics Algebra 2 Unit 11 Activity Bundle
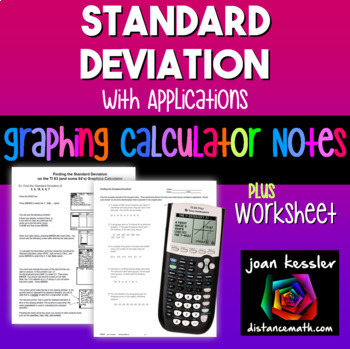
Standard Deviation on TI-84 Reference Sheets plus Practice
With this Determining the Standard Deviation on the TI 83 TI 84 Graphing Calculator plus HW step by step reference sheet your students will learn to use the graphing calculator effectively in finding the standard deviation from a data set. Use as Binder Notes or printed smaller for Interactive Notebooks.What's included?Two reference/handouts for students to learn how to find the Standard Deviation for both a population and for sample. One is for the TI 83 (yes, still in use) and the other for th
Subjects:
Grades:
8th - 11th
CCSS:
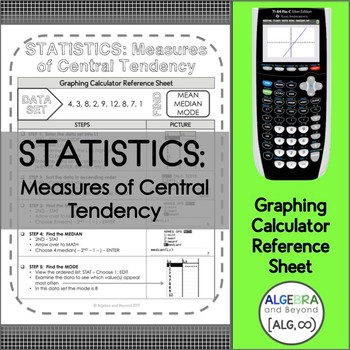
Statistics | Measures of Central Tendency | TI-84 Calculator Reference Sheet
This graphing calculator reference sheet on measures of central tendency guides students step-by-step on how to create a list and find the mean, median and mode.Teaching graphing calculator skills help students with: • Speed• Making connections• Checking for accuracy• Leaping hurdles*Reference sheet can be used with a TI-83 or TI-84 graphing calculator. Please look at the preview to find out more information about this resource.Check out more graphing calculator sheets here or get all of them...
Subjects:
Grades:
10th - 12th
Types:
CCSS:
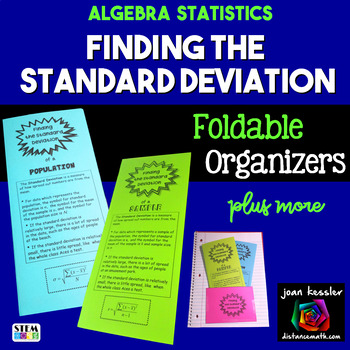
Standard Deviation Foldable Organizers for Statistics
This hands on resource is designed to help your students understand and evaluate the Standard Deviation from a set of data. Many students not only have a difficult time finding the standard deviation by hand, but also get confused with notation and whether they are finding the sample standard deviation or the population standard deviation. Included in the Lesson: Two Tri Fold handouts, one for the population standard deviation and one for sample standard deviation. Each foldable comes with
Subjects:
Grades:
9th - 12th
CCSS:
Also included in: Algebra 2 and PreCalculus Bundle of Foldables and Organizers
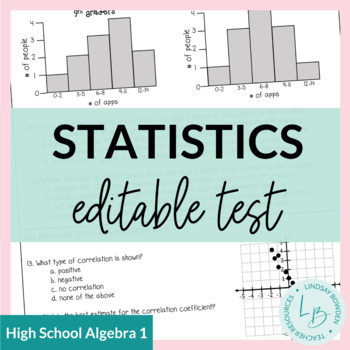
Statistics Test with Study Guide
This resource includes a statistics unit test and study guide for an Algebra 1 statistics unit.The editable versions are PowerPoints where you can edit text as needed.Topics covered:Histograms, Dot Plots, Box and Whisker PlotsRange, Interquartile RangeMean Absolute DeviationTwo-Way Frequency TablesScatter Plots and CorrelationLine of Best Fit There are 20 multiple choice questions and 10 free response questions. Test and answer documents are divided so that if you only wanted to give the multipl
Subjects:
Grades:
8th - 10th
Types:
CCSS:
Also included in: Statistics Unit Bundle

Statistics Survey Project - Project Based Learning (PBL) with Math
Watch your students dive into the world of math as they create, execute, and analyze their own survey! Students will demonstrate mastery of data gathering, survey sampling, developing appropriate survey questions, data tables, Direct Variation, discrete graphs, dot plots, box and whisker graphs, and calculating the inter-quartile range.The Unique Survey Project is highly engaging, capitalizing on the innate curiosity of the adolescent mind. You will love the low-prep instructional guide. Your st
Subjects:
Grades:
6th - 10th
Types:
Also included in: Fun with Ratios Activities Bundle - 7th Grade PBL with Math
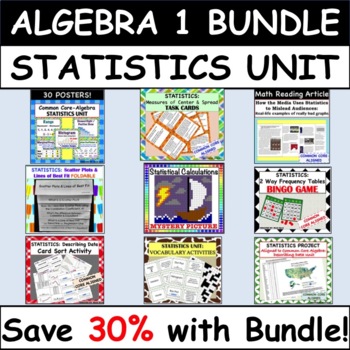
Common Core Algebra 1: STATISTICS UNIT - BUNDLE PRICE!
This Statistics Unit Bundle set includes a wide variety of 10 resources all geared towards the Common Core Algebra 1 course.Resources Included:Culminating Project Based on Real World Data30 PostersCard Sort ActivityMath Reading Article & Follow Up SummaryTask Cards ActivityFoldableMystery Color Picture Activity2 Vocabulary Activities including: Matching definition/vocabulary card set & crossword puzzleBingo GameLine of Best Fit - Class LabDifferentiation:Each resource in the bundle is di
Subjects:
Grades:
8th - 11th
Types:
CCSS:
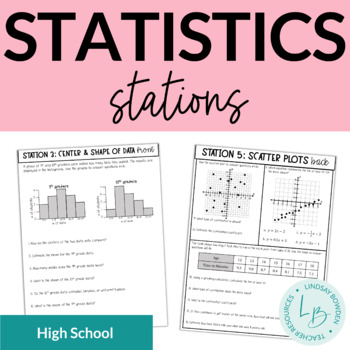
Statistics Stations
These statistics stations have 5 front and back stations that cover:histograms and dot plotstwo-way frequency tablescenter and shape of data (central tendency, peaks, symmetrical or skewed)spread of data (range, IQR, MAD)scatter plots (correlation, line of best fit, linear regression)Includes a student answer sheet and answer keys!Check out my YouTube video on stations here!You may also like:Box and Whisker Plots Notes & WorksheetsHistograms Notes & WorksheetsScatter Plots Notes and Work
Subjects:
Grades:
8th - 10th
Types:
CCSS:
Also included in: Statistics Unit Bundle
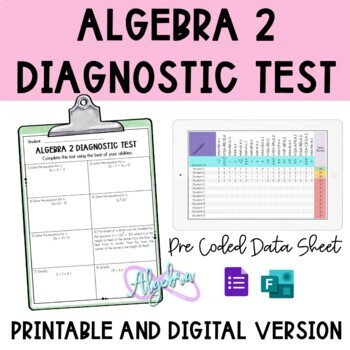
Algebra 2 Diagnostic Test Printable and Digital (Back to School)
Want to know where your students are at the beginning of the year to plan sucessfully? This math diagnostic test will help you identify their weaknesses and strenghts so you can access and differentiate for each of your students. Once you analyze the data you will be able to teach your current level standards while having interventions on the most needed pre-course skills. What's included?Algebra 2 Diagnostic Test (Digital and Printable)Digital version in both Google Form™ and Microsoft Form™Sta
Grades:
9th - 11th
Types:
CCSS:
Also included in: Diagnostic Test for Algebra 1, Geometry and Algebra 2 FULL PACK
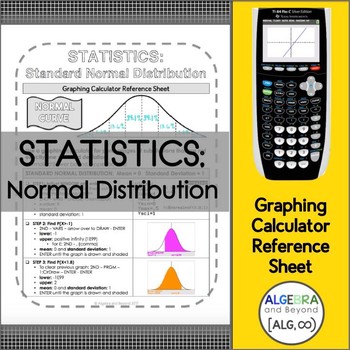
Normal Distribution | Statistics | TI-84 Graphing Calculator Reference Sheet
This graphing calculator reference sheet on normal distribution guides students step-by-step on how to calculate percentages and graph the curve. (Normal and Standard Normal Distribution included)Teaching graphing calculator skills help students with: • Speed• Making connections• Checking for accuracy• Leaping hurdles*Reference sheet can be used with a TI-83 or TI-84 graphing calculator. Please look at the preview to find out more information about this resource.Check out more graphing calculato
Subjects:
Grades:
10th - 12th
Types:
CCSS:
Showing 1-24 of 98 results


