17 results
Graphing Common Core HSS-ID.A.4 resources
Algebra 1 Curriculum
Get a complete High School Algebra 1 curriculum including units on solving equations and inequalities, linear functions, exponents and exponential functions, factoring polynomials, quadratics, and more! These ready-to-use Algebra 1 resources include everything you need to teach high school algebra to your on-level or lower-level/special education class. Supplements would be needed for an honors class.Each unit contains guided notes, practice worksheets for the classroom and/or homework, activiti
Grades:
8th - 11th
CCSS:

Statistics Survey Project - Project Based Learning (PBL) with Math
Watch your students dive into the world of math as they create, execute, and analyze their own survey! Students will demonstrate mastery of data gathering, survey sampling, developing appropriate survey questions, data tables, Direct Variation, discrete graphs, dot plots, box and whisker graphs, and calculating the inter-quartile range.The Unique Survey Project is highly engaging, capitalizing on the innate curiosity of the adolescent mind. You will love the low-prep instructional guide. Your st
Subjects:
Grades:
6th - 10th
Types:
Also included in: Fun with Ratios Activities Bundle - 7th Grade PBL with Math
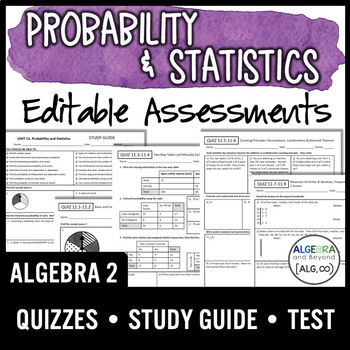
Probability and Statistics Assessments | Quizzes | Study Guide | Test
These assessments will help you assess your students' skills on probability and statistics! The EDITABLE assessments cover basic, compound, independent, dependent, and mutually exclusive events and probabilities. Students analyze scenarios for the counting principles, permutations, and combinations. Statistics included are measures of variation, frequency, normal distribution, and z-scores. Print and go OR edit to meet your standards.INCLUDED:4 Quizzes, a Study Guide, and a Unit TestTOPICS:Basic
Subjects:
Grades:
9th - 11th
Types:
CCSS:
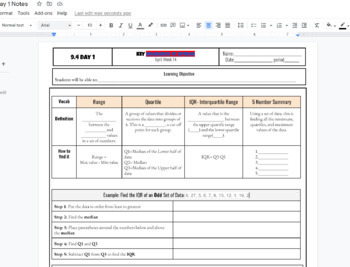
IQR interquartile Range and 5 number summary box and whisker plot Notes
IQR interquartile Range and 5 number summary box and whisker plot Notes including Q1, Q2, Q3, Min and Max and step by step both examples of finding the IQR and creating a box and whisker plot. Used in HS math 1 class WITH KEY INCLUDED AS a link to a printable PDF
Subjects:
Grades:
7th - 12th, Higher Education, Adult Education
CCSS:

Fun with Ratios Activities Bundle - 7th Grade PBL with Math
The purpose of the Fun with Ratios Activities Bundle is to give students the opportunity to use creativity to apply ratios, proportions, and percentages in real-world settings. This bundle includes three unique tasks: Black Friday Mastery Task, Direct Variation Poster Mastery Task, and the Unique Survey Project. These activities and their accompanying materials are suited for students in grades 7 through 9. These lessons make excellent sub plans. Each project takes approximately two 60-minute bl
Subjects:
Grades:
7th - 9th
Types:
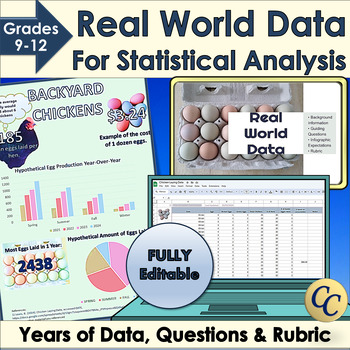
Real World Data for Statistical Analysis and Infographic Project
Give your students access to real world data for your statistical analysis unit or data literacy! Dive into statistics with Microsoft Excel™ or Google Sheets™ and years of data. Learn how to use standard deviation, mean or median to interpret data. Choose the best graphs to display conclusions in an infographic. Works great for science fairs! ✔ Includes an infographic project! (Template, expectations, and rubric). ✔ Everything is fully editable and you and your students can even use the images
Grades:
9th - 12th
Types:
CCSS:
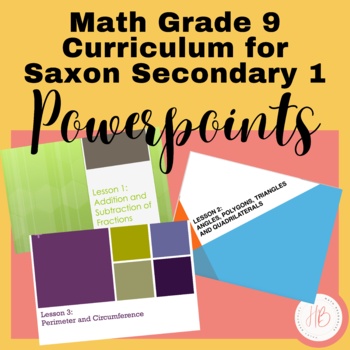
9th Grade Saxon Secondary 1 Math Powerpoints
These 120 Powerpoint lessons work hand in hand with the Saxon Algebra 1 math textbook. If you do not teach the Saxon program then these Powerpoints can be used to help teach the Secondary 1 Common Core. Each Powerpoint consists of a lesson overview which includes formulas and direct instructions. After that there are several practice problems that allows students to put into practice what they just learned. This is a great opportunity for group work as well as for the teacher to walk around the
Grades:
8th - 9th
Types:
CCSS:
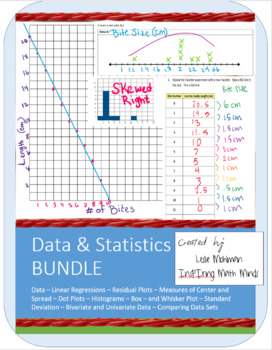
Bundle: Data and Statistics Unit and Twizzlers Project
This bundle includes a 5 lesson unit and a 5 part project.The project, students collect data, create graphs: scatterplots, dot plots, histograms, box-and-whisker plots. They analyze bivariate data by drawing lines of best fit, finding the correlation coefficient, linear regressions, and residual plots. They analyze univariate data looking at its shape (symmetric or skewed) and calculating the appropriate centers and spreads. With this fast and easy method of data collection, students each get
Subjects:
Grades:
7th - 12th
Types:
CCSS:
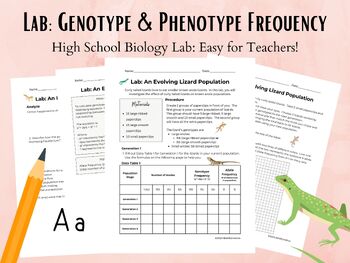
Lab: Genotype and Phenotype Frequency in Lizard Populations
This is a High School Biology lab where students will model changes in a populations traits. They will calculate genotype and phenotype frequency and monitor its changes over the course of 4 generations of lizards. Students will use A data table2 line graphthe Hardy Weinberg formula for genotype frequency Answer analysis questions. Teacher setup is minimal. Supplies are inexpensive and easily found in schools or at an office supply store. NGSS Standard CoveredLS3: Heredity: Inheritance and Var
Grades:
9th - 12th, Higher Education
Types:
CCSS:
NGSS:
HS-LS3-3
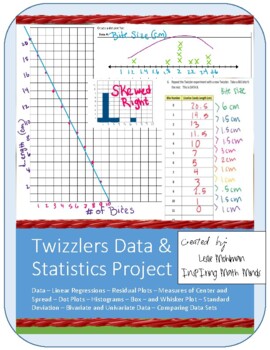
Twizzlers Data and Statistics Project in 5 Parts
In this project, students collect data, create graphs: scatterplots, dot plots, histograms, box-and-whisker plots. They analyze bivariate data by drawing lines of best fit, finding the correlation coefficient, linear regressions, and residual plots. They analyze univariate data looking at its shape (symmetric or skewed) and calculating the appropriate centers and spreads. With this fast and easy method of data collection, students each get their own data and most students will get one set of d
Subjects:
Grades:
7th - 12th
Types:
CCSS:
Also included in: Bundle: Data and Statistics Unit and Twizzlers Project
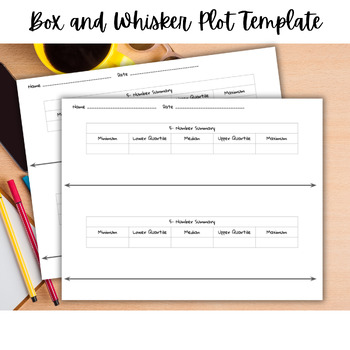
Box Plot Template | Box and Whisker Plot Template | Graphing Template
Box and Whisker Plot TemplateSay goodbye to data confusion and hello to organized insights with our Box Plot Template! This tool simplifies data organization with a five-number summary and a ready-to-use number line, so students can jump right into visualizing data distributions.With two box plots on one paper, students can easily compare data, spot outliers, identify medians, quartiles, and more - all at a glance!
Subjects:
Grades:
8th - 12th
CCSS:
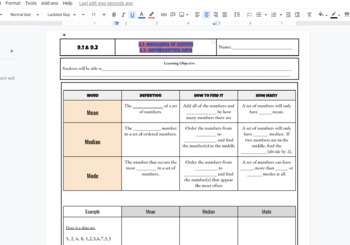
Mean, Median, Mode and Dot plot, bar graph histogram Fillable Notes Scaffolded
Central Tendencies: Mean, Median and Mode Fillable Notes Scaffolded used in math 1 classroom to introduce the data unit. Also includes dot plot, histogram and bar chart lesson. KEY IS INCLUDED!
Subjects:
Grades:
7th - 12th, Higher Education, Adult Education
CCSS:
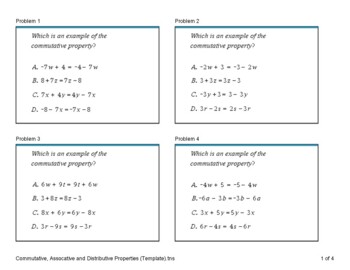
Algebra 1 Workbook (2020)
This Algebra 1 file contains 8 question or 16 question or 24 question practice problems and 16 questions chapter review tests. This was created to help out teachers looking for quality resources with answer keys.Topics:1 - Expressions and Equations2 - Inequalities3 - Domain and Range4 - Linear Equations5 - Exponents6 - Radicals7 - Systems8 - Polynomial Arithmetic9 - Polynomial Graphs10 - Regression Analysis11 - Statistics
Grades:
7th - 12th
Types:
CCSS:
Also included in: Algebra and Geometry Workbook and TI-84/TI-Nspire Step
A Fun Introduction to Probability
This product contains fourteen pages that introduce probability by graphing the LEGOs and comparing the number of studs on LEGO bricks. These statistics will be figured in fractions, decimals and percentages. Graphing will be done on bar graphs and pie graphs. The worksheets are colorful and engaging for students. Students will learn to find the mean, median and mode of different numbers of studs on LEGO bricks. Students will find their own statistics and combine them with the statistics of ot
Subjects:
Grades:
4th - 9th
Algebra 2 Workbook (2020)
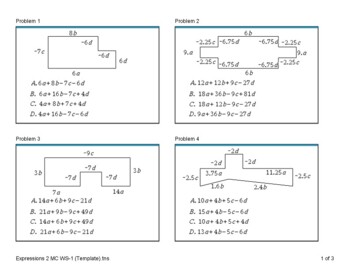
This Algebra 2 file contains 8 question or 16 question or 24 question practice problems and 16 questions chapter review tests. This was created to help out teachers looking for quality resources with answer keys.Topics:1 - Polynomial Arithmetic2 - Radicals3 - Absolute Value and Inequalities4 - Systems5 - Polynomial Graphs6 - Graph Transformations7 - Domain and Range8 - Inverse and Composite9 - Exponents and Asymptotes10 - Regression Analysis11 - Series and Sequences12 - Statistics
Subjects:
Grades:
9th - 12th, Higher Education, Adult Education
Types:
CCSS:
Also included in: Algebra 2 Bundle
Determining Standard Deviations Worksheet
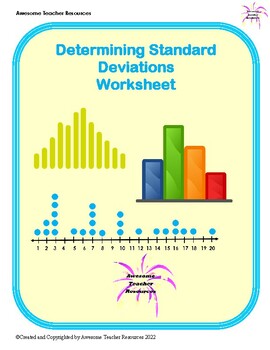
This worksheet begins with suggestions for reinforcement or enrichment with regards to data. In an effort to help students, there is an example problem at the start of the worksheet with step-by-step directions for finding the mean and standard deviation for a set of data. Then there are 5 problems, three of which have a set of data provided. The last 2 problems require students to have access to a 6-sided die and a deck of cards. Tables are provided to help organize calculations. There is an a
Subjects:
Grades:
7th - 10th
CCSS:
Standard Deviation - Printable & Digital Activity - Theodor Geisel Person Puzzle
Bring to life the traditional practice class or homework assignment with some global competency and diversity! While your students practice with correlation coefficients, they can learn about the courageous worker right's advocate, Chico Mendes!Person Puzzles are designed to highlight individuals with diverse backgrounds who have made significant contributions to our world. I typically use Person Puzzles as timed warm-ups which allows me to share a little about the person's background before my
Subjects:
Grades:
8th - 12th
Types:
CCSS:
Also included in: Person Puzzles PRE-ALGEBRA BUNDLE - Printable & Digital Activities
Showing 1-17 of 17 results


