19 results
Common Core HSS-ID.B.5 interactive notebooks
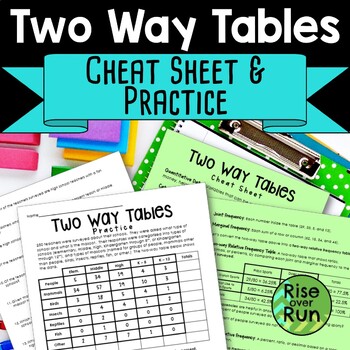
Two Way Frequency Tables Guided Notes and Practice Worksheet
Need an engaging way to get students learning about two way tables and bivariate data? This set of fill-in cheat sheets and practice helps students make sense of data and statistics represent in 2 way frequency tables. This set includes:Two Way Tables Cheat Sheets (2 Pages)These handouts have blanks to fill in with important vocabulary terms and examples of two way frequency tables. Questions are included too. This works great to fill out as a class to give students a solid foundation to und
Subjects:
Grades:
8th - 9th
CCSS:
Also included in: 8th Grade Math Activities & Lessons Bundle for the Whole Year
Two Way Frequency Tables and Relative Frequency Notes
NEW AND UPDATED FORMAT*
After careful study I am reformatting my notes to be easier to understand and be better resources for students. They will also more directly address the Common Core standards, and more specifically the Math Florida Standards (my home state).
I have designed this listing to directly address the listed standard for 8th grade, but it could be used in any grade covering frequency tables and relative frequency.
This PDF document contains:
1. Guided, two-column notes format
Subjects:
Grades:
8th - 10th
CCSS:
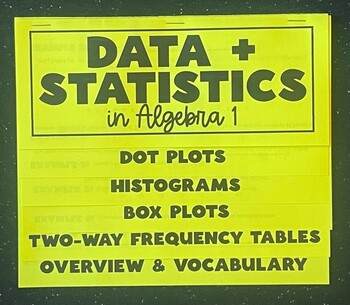
Data and Statistics in Algebra 1 Foldable Notes - Fully Editable
This editable algebra 1 foldable provides an introduction and overview for most of the univariate and bivariate data and statistics taught in the Algebra 1 standards. It is organized by the following tabs:Dot PlotsHistogramsBox PlotsTwo-Way Frequency TablesOverviewWithin the foldable there are at least two examples for each type of graph. It also allows for you to review/ address the following terms: mean, median mode, range, interquartile range, outliers, standard deviation, marginal and joi
Grades:
8th - 10th
CCSS:
Also included in: Data Analysis and Statistics Foldable Bundle
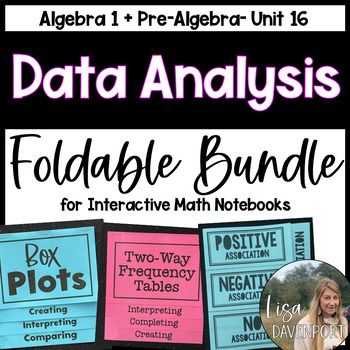
Data Analysis and Statistics Foldable Bundle
This foldable bundle includes skills associated with data and statistics taught within middle school math or algebra 1 standards:Mean, Median, Mode, RangeComparing CentersBox PlotsDot PlotsDisplaying Numerical DataAssociation within Scatter PlotsScatter PlotsWriting an Equation for a Trend LineStandard Deviation + The Empirical RuleData + Statistics in Algebra 1 Overview (Dot Plots, Histograms, Box Plots, + Two-Way Frequency TablesDetailed answer keys are included for each foldable.All of these
Grades:
7th - 10th
CCSS:
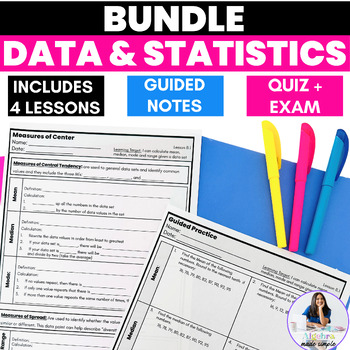
Data Statistics Algebra 1 Skills Scaffolded Guided Notes Unit Practice Test Prep
This complete, ready to print Data and Statistics Unit includes 4 Scaffolded Lessons with Guided Notes focused on measures of central tendency mean, median, mode and range, creating and analyzing dot plots, histograms, frequency tables and box and whisker plots. Each lesson includes Class Notes with Essential Vocabulary, a Guided Practice page along with Independent Practice and Exit Tickets. This Bundle also includes a Student Pacing Page for Notebooks and Binders, along with a Post Unit Exam
Subjects:
Grades:
9th
CCSS:
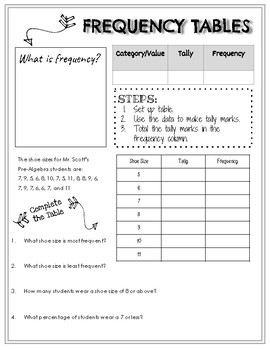
Notes & Practice: Creating a Frequency Table
This set of notes and practice is a great way to introduce or review frequency tables. This would be ideal for an interactive notebook. This resource can be used in the middle grades or with an Algebra I course.
Subjects:
Grades:
6th - 9th
CCSS:
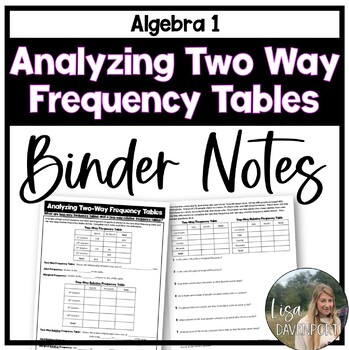
Analyzing Two Way Frequency Tables - Binder Notes for Algebra 1
This set of algebra 1 binder notes provides the teacher and students with guided notes on two-way frequency tables and two-way relative frequency tables. On the front side, students will complete each type of frequency table by filling in missing data and calculating the ratios as well as complete the definitions for: two-way frequency table, joint frequency, marginal frequency, two-way relative frequency table, joint relative frequency, marginal relative frequency, and conditional relative fre
Subjects:
Grades:
7th - 9th
CCSS:
Also included in: Algebra 1 Editable Binder Notes Bundle for the Entire Year
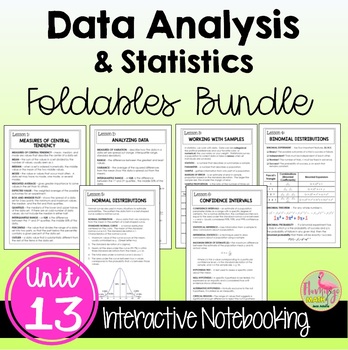
Data Analysis and Statistics FOLDABLES™ (Algebra 2 - Unit 13)
This bundle of 8-page Bound-Book-Style Foldables includes six lessons on topics in UNIT 13: Data Analysis & Statistics for your Algebra 2 Honors students. A set of finished notes and directions for creating the Foldables are also included.⭐ Bonus: A set of Google Slides for presenting the lesson and video lesson links are now included for distance learning and flipped classroom methods.☆FOLDABLESThree options of an 8-page Bound-Book Foldable® will help with differentiation.Option #1: All voc
Subjects:
Grades:
8th - 11th, Higher Education
CCSS:
Also included in: Algebra 2 Curriculum Big Bundle | Flamingo Math
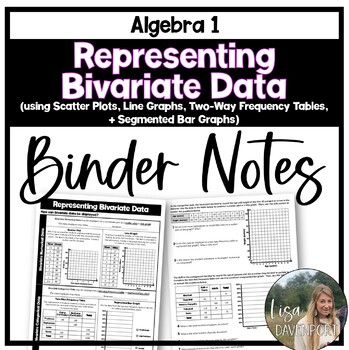
Representing Bivariate Data - Binder Notes for Algebra 1
This set of algebra 1 binder notes provides the teacher and students with guided notes on bivariate numerical and categorical data representations, including: scatter plots, line graphs, two-way frequency tables, and segmented bar graphs. Please note: This is a very broad overview of each of these 4 types of graphs. The front side of the notes focus on constructing each of them and the back side also has students analyze and compare the types of graphs. This would serve as a fantastic introd
Subjects:
Grades:
7th - 9th
CCSS:
Also included in: Algebra 1 Editable Binder Notes Bundle for the Entire Year
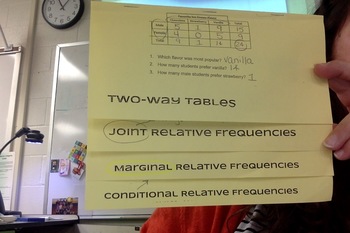
Two-Way Table foldable
This resource is a 4-page printable that you copy back-to-back and fold to make a foldable about two-way tables. It introduces vocabulary associated with two-way tables: joint relative frequencies, marginal frequencies, conditional frequencies through examples and practice questions. I complete this together with my students at the beginning of this topic, and encourage them to use it as a resource as they complete additional practice and review. *NOTES: I use class data for the examples. **DIR
Subjects:
Grades:
8th - 9th
CCSS:
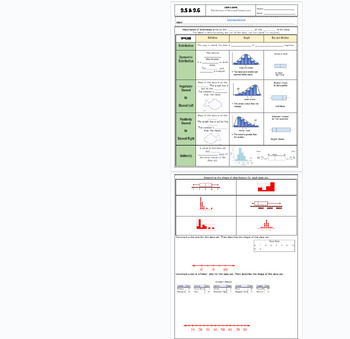
Data Distribution positive/negative skewed fillable notes UPDATED
Unit 9: Data and Stats: Updated(No 9.3/ Skip)9.5/9.6 Data Distribution (skewness)Students go over the vocabulary and complete the examples with the vocabulary scaffolded. Skewness is explained and how to identify it comparing data charts and box and whisker plots. Uses many visuals and examples to differentiate between that different graphs. Notes are scaffolded. Includes hook video hyperlinked on the "learning objective" title. Key is included and hyperlinked as a PDF in the heading highlighted
Subjects:
Grades:
6th - 12th, Higher Education, Adult Education
CCSS:
Also included in: Unit 9: Data and Statistics Fillable Notes
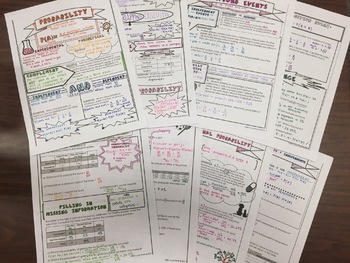
Interactive Probability Notes
This bundle includes 4 different interactive notes for: overall probability vocab, compound events, probability models, and conditional probability. Also included are two "cheat sheets" for students to have in interactive notebooks: one for probability symbols and one for the basics of a deck of cards.
Subjects:
Grades:
9th - 12th
CCSS:
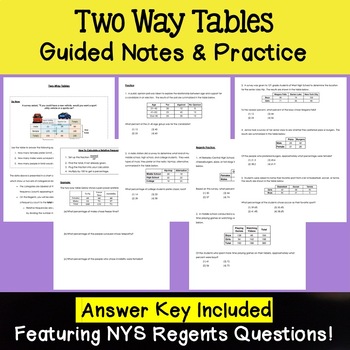
Two-Way Frequency Tables - Notes and Practice - Algebra 1 Regents
This is your perfect resource for two way frequency tables with NYS Algebra 1 Regents questions! The notes are scaffolded and include a Do Now of reading a two-way table, brief guided notes and steps for finding relative frequencies, examples, and Regents practice problems.A full answer key is included. This product can be edited for your students' needs. Perfect for Algebra 1 Regents Prep and can be a great resource for your Special Education students!*Regents problems have been updated to i
Subjects:
Grades:
8th - 10th
CCSS:
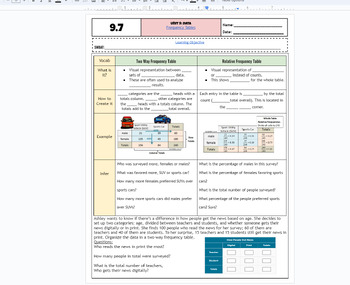
Frequency Tables & Relative Frequency Tables fillable notes UPDATED
Unit 9: Data and Stats: Updated(No 9.3/ Skip)9.7 Frequency Tables Students go over the vocabulary and complete the examples with the vocabulary scaffolded. Students examine a categorical table/frequency table and also use that information to create relative frequency tables. Different real-world examples and problems are used. Emphasized how percents and decimals are calculated. Notes are scaffolded. Includes hook video hyperlinked on the "learning objective" title. Key is included and hyperli
Subjects:
Grades:
6th - 12th, Higher Education, Adult Education
CCSS:
Also included in: Unit 9: Data and Statistics Fillable Notes
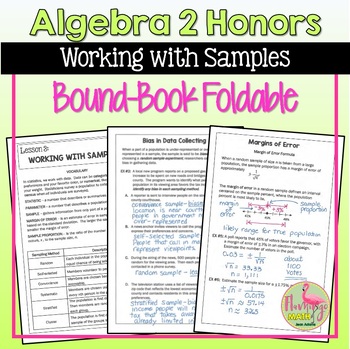
Working With Samples Foldable
Working With Samples Foldable:This 8-page Bound-Book-Style Foldable is designed for students enrolled in Algebra 2 Honors with a general knowledge of basic probability. Your students will love this mini-booklet they create for the third lesson in the unit on Data Analysis and Statistics.Learning Objectives:★ Analyze experimental data to find sample proportions★ Determine the margin of error★ Determine bias and reliability of samples and categorize types of sampling from different scenarios☆FOL
Subjects:
Grades:
8th - 11th
CCSS:
Also included in: Data Analysis and Statistics MEGA Bundle (Algebra 2 - Unit 13)
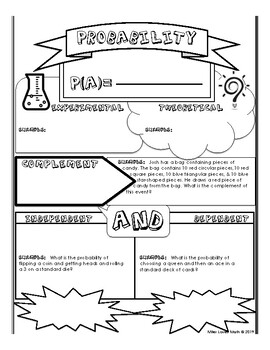
Probability Vocabulary Notes
These notes include an overview of the main definitions in probability: types of probability, complement, independent/dependent events, mutually exclusive, overlapping, frequency tables, and conditional probability.
Subjects:
Grades:
9th - 12th
CCSS:
Also included in: Interactive Probability Notes
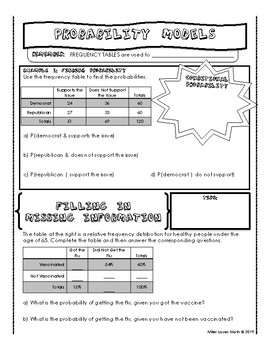
Probability Models Notes
These interactive notes cover questions involving two-way frequency tables. Includes several examples using compound and conditional probability.
Subjects:
Grades:
9th - 12th
CCSS:
Also included in: Interactive Probability Notes
Interactive Notebook Frequency Table Foldable
This foldable is a great way to review frequency tables. It can be used as a review prior to discussing two-way tables.
Subjects:
Grades:
6th - 9th
CCSS:
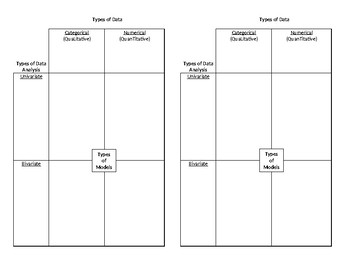
Intro to Data Analysis Graphic Organizer
I created this template for an introduction to my data analysis unit in Algebra I. We discuss and define categorical vs. numerical data, univariate vs. bivariate analysis, and the different graphs or models that apply to each. Since we use Interactive Notebooks, it is designed to be half a page.
Subjects:
Grades:
7th - 12th
CCSS:
Showing 1-19 of 19 results

