25 results
Common Core HSS-ID.B.5 graphic organizers
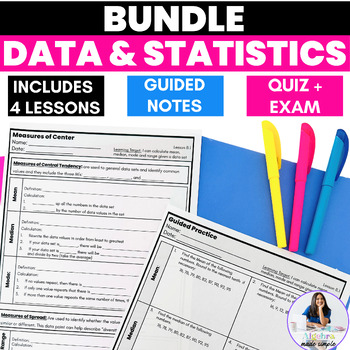
Data Statistics Algebra 1 Skills Scaffolded Guided Notes Unit Practice Test Prep
This complete, ready to print Data and Statistics Unit includes 4 Scaffolded Lessons with Guided Notes focused on measures of central tendency mean, median, mode and range, creating and analyzing dot plots, histograms, frequency tables and box and whisker plots. Each lesson includes Class Notes with Essential Vocabulary, a Guided Practice page along with Independent Practice and Exit Tickets. This Bundle also includes a Student Pacing Page for Notebooks and Binders, along with a Post Unit Exam
Subjects:
Grades:
9th
CCSS:
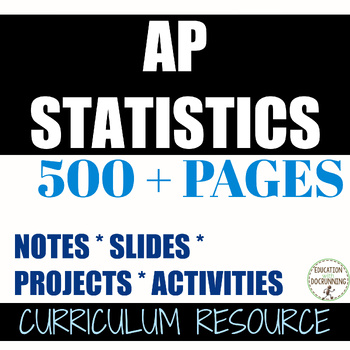
AP Statistics
This AP Statistics curriculum bundle contains the following (please take time to preview video and/or individual item previews):Guided Notes and Graphic Organizers (EDITABLE)Exhibition stations (slides) with guided notes (EDITABLE)ActivitiesProjects (EDITABLE)Exams (EDITABLE)Teacher's pacing guide and suggested order for each unit Review in AP style for preparation for the APCOMING: powerpoint with guided notes for each of 9 units NEW! UNIT 1 and UNIT 2 slides and editable notes are currently in
Subjects:
Grades:
10th - 12th
CCSS:
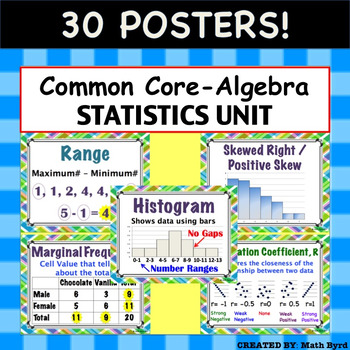
Common Core Algebra - Statistics Unit: Describing Data POSTERS
30 Posters! Each 8.5" x 11" in size. Posters are aligned with Common Core's Algebra - Statistics: Describing Data Unit. Posters Included:MeanMedianModeRangeInterquartile RangeOutlierMean Absolute DeviationMeasures of CenterMeasures of SpreadDot PlotHistogramBox PlotNormal/ Bell Shaped DistributionSkewed Right/Positive SkewSkewed Left/ Negative SkewUniform2 Way Frequency TableJoint FrequencyMarginal Frequency2 Way Relative Frequency TableConditional Relative FrequencyScatter PlotCorrelationCorrel
Subjects:
Grades:
8th - 11th
CCSS:
Also included in: Common Core Algebra 1 POSTERS - BUNDLE PRICE!
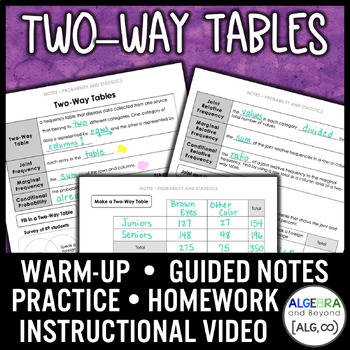
Two-Way Tables Lesson | Warm-Up | Guided Notes | Homework
In this lesson, students learn about two-way frequency tables and relative frequency.Included• Video Warm-Up: Students preview the lesson by watching a short video on YouTube and then come to class with some prior knowledge. A warm-up handout included reviewing what students learned from the video. A bonus video link is also included!• Notes & Practice: Four pages of notes and practice.• Homework: Two pages containing 7 multi-step homework problems.• Answer Keys: Completely worked out answer
Subjects:
Grades:
10th - 12th
CCSS:
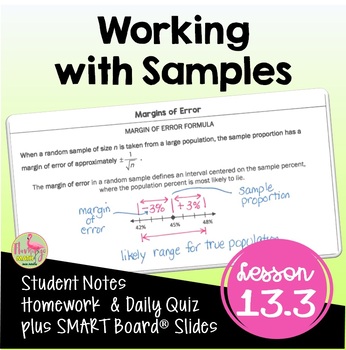
Working with Samples (Algebra 2 - Unit 13)
Working with Samples Algebra 2 Lesson:Your Pre-AP Algebra 2 Honors students will find draw, analyze and interpret box-and-whisker plots, find outliers, and calculate measures of central tendency in this unit 13 lesson on Data Analysis & Statistics that cover the concepts in depth. #distancelearningtptWhat is included in this resource?⭐ Guided Student Notes⭐ Google Slides®⭐ Fully-editable SMART Board® Slides⭐ Homework/Practice assignment⭐ Lesson Warm-Up (or exit ticket)⭐Daily Content Quiz (ho
Subjects:
Grades:
8th - 11th, Higher Education
CCSS:
Also included in: Algebra 2 Curriculum Mega Bundle | Flamingo Math
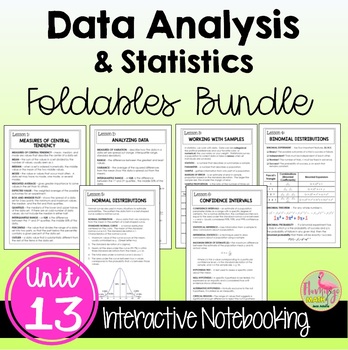
Data Analysis and Statistics FOLDABLES™ (Algebra 2 - Unit 13)
This bundle of 8-page Bound-Book-Style Foldables includes six lessons on topics in UNIT 13: Data Analysis & Statistics for your Algebra 2 Honors students. A set of finished notes and directions for creating the Foldables are also included.⭐ Bonus: A set of Google Slides for presenting the lesson and video lesson links are now included for distance learning and flipped classroom methods.☆FOLDABLESThree options of an 8-page Bound-Book Foldable® will help with differentiation.Option #1: All voc
Subjects:
Grades:
8th - 11th, Higher Education
CCSS:
Also included in: Algebra 2 Curriculum Big Bundle | Flamingo Math
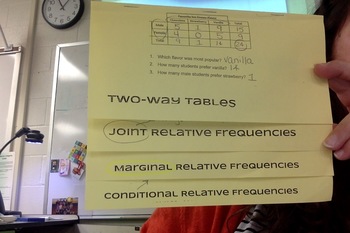
Two-Way Table foldable
This resource is a 4-page printable that you copy back-to-back and fold to make a foldable about two-way tables. It introduces vocabulary associated with two-way tables: joint relative frequencies, marginal frequencies, conditional frequencies through examples and practice questions. I complete this together with my students at the beginning of this topic, and encourage them to use it as a resource as they complete additional practice and review. *NOTES: I use class data for the examples. **DIR
Subjects:
Grades:
8th - 9th
CCSS:
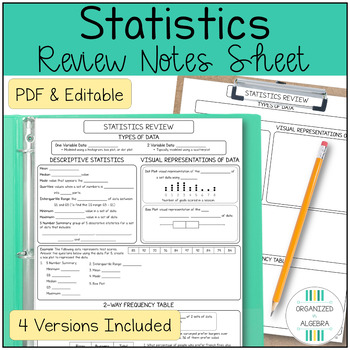
Statistics Review Notes Sheet Algebra 1 Test Prep
Looking for a review of Statistics that meets the needs of all your students, without the time commitment of differentiating?This no-prep, differentiated Algebra 1 Review Sheet is perfect to get your students ready for an end of chapter or end of year test in Algebra (including the NYS Algebra 1 Regents exam)!Includes 4 versions (Reference Sheet, Filled In Notes, Guided Notes & Graphic Organizer) and comes as a no prep, printable PDF AND an editable PowerPoint !Topics Included: Types of Data
Subjects:
Grades:
8th - 11th
CCSS:
Also included in: Statistics Algebra 1 Differentiated Notes & Worksheet Bundle
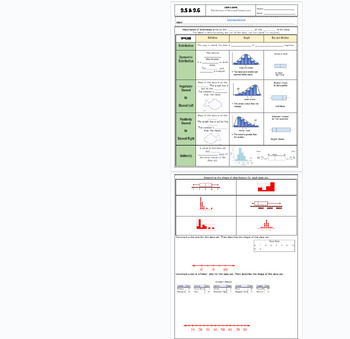
Data Distribution positive/negative skewed fillable notes UPDATED
Unit 9: Data and Stats: Updated(No 9.3/ Skip)9.5/9.6 Data Distribution (skewness)Students go over the vocabulary and complete the examples with the vocabulary scaffolded. Skewness is explained and how to identify it comparing data charts and box and whisker plots. Uses many visuals and examples to differentiate between that different graphs. Notes are scaffolded. Includes hook video hyperlinked on the "learning objective" title. Key is included and hyperlinked as a PDF in the heading highlighted
Subjects:
Grades:
6th - 12th, Higher Education, Adult Education
CCSS:
Also included in: Unit 9: Data and Statistics Fillable Notes
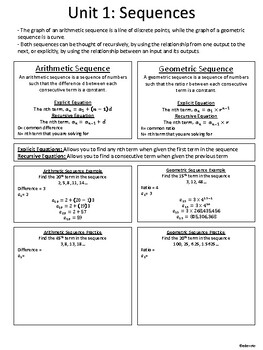
Open Up Algebra 1: EOY One Page Chapter Reviews
End of Year One Pager reviews for each chapter in Illustrative Math Algebra 1 Open Up Curriculum. Reviews include practice problems for students and act as a study guide to save for future lessons or final exams.
Subjects:
Grades:
7th - 10th
CCSS:
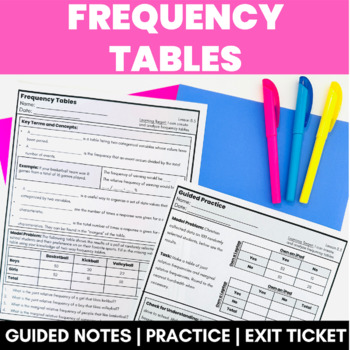
Frequency Tables Scaffolded Guided Notes with Practice Exit Ticket Lesson
These Guided Notes focus on how to create and analyze Frequency Tables. These scaffolded notes can be used in whole-class, small group, 1:1, the differentiation possibilities are endless to teach students calculate joint relative frequencies and marginal relative frequencies. They contain essential vocabulary along with a Guided Practice Worksheet, Independent Practice Worksheet, and Test Prep Worksheet that is aligned with Common Core Standards.➡️ Check out the PREVIEW to see if this resource i
Subjects:
Grades:
8th - 9th
CCSS:
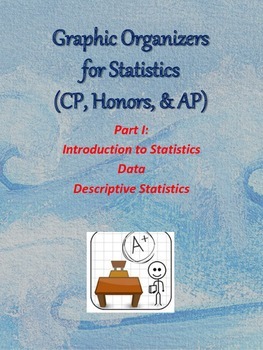
Graphic Organizers for Statistics 1 - Descriptive Statistics
These organizers, which are designed for the first part of a High School or Freshman College level course, delve into the concepts taught about Descriptive Statistics. This resource includes 15 blank organizers, 15 filled-in organizers (keys), notes about each organizers, and templates for making pie charts, bar charts, and scatterplots.
Subjects:
Grades:
11th - 12th, Higher Education, Adult Education
Types:
CCSS:
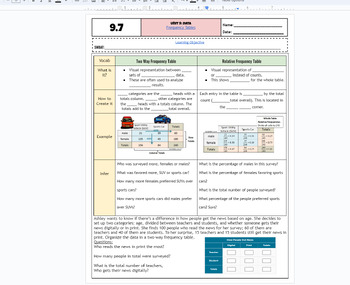
Frequency Tables & Relative Frequency Tables fillable notes UPDATED
Unit 9: Data and Stats: Updated(No 9.3/ Skip)9.7 Frequency Tables Students go over the vocabulary and complete the examples with the vocabulary scaffolded. Students examine a categorical table/frequency table and also use that information to create relative frequency tables. Different real-world examples and problems are used. Emphasized how percents and decimals are calculated. Notes are scaffolded. Includes hook video hyperlinked on the "learning objective" title. Key is included and hyperli
Subjects:
Grades:
6th - 12th, Higher Education, Adult Education
CCSS:
Also included in: Unit 9: Data and Statistics Fillable Notes
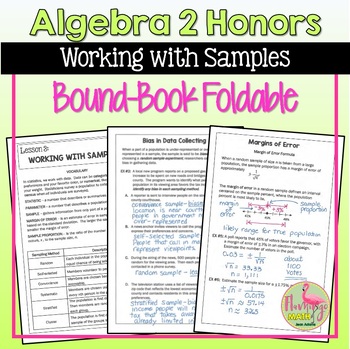
Working With Samples Foldable
Working With Samples Foldable:This 8-page Bound-Book-Style Foldable is designed for students enrolled in Algebra 2 Honors with a general knowledge of basic probability. Your students will love this mini-booklet they create for the third lesson in the unit on Data Analysis and Statistics.Learning Objectives:★ Analyze experimental data to find sample proportions★ Determine the margin of error★ Determine bias and reliability of samples and categorize types of sampling from different scenarios☆FOL
Subjects:
Grades:
8th - 11th
CCSS:
Also included in: Data Analysis and Statistics MEGA Bundle (Algebra 2 - Unit 13)
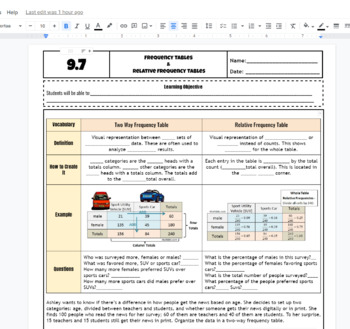
Two way frequency tables and relative frequency table scaffolded fillable notes
Two way frequency tables and relative frequency table scaffolded fillable notes with KEY included for Math 1 HS class. This can be used as a graphic organizer. 100 percent editable to your liking! Introduce the vocabulary with simple problems to finish out the tables and find the percentages of each category. This is an easy introduction lesson students can use for their understanding of frequency tables. You can add in conditional and marginal tables for deeper dive into the concept. Real-worl
Subjects:
Grades:
7th - 12th, Higher Education, Adult Education
CCSS:
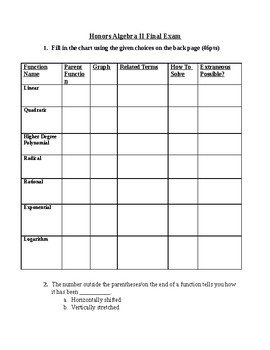
Honors Algebra 2 Final Exam
This is a concept based final exam suitable for average to honors level Algebra 2 curricula. It follows basic common core skill sets and includes probability, number sets, standard distribution, and two-way tables but not trigonometry. I use it as an assessment for the students I home-school and study guide for students in public or private school settings. The first section involves matching graphs, key terms/skills, and parent equations to the various functions introduced in Algebra 2. The voc
Subjects:
Grades:
10th - 12th
CCSS:
Also included in: Algebra 2 Bundle
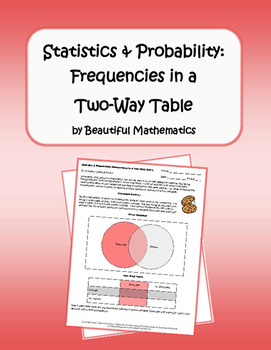
Statistics & Probability: Frequencies in a Two-Way Table
Great visual tool for learning about frequency tables!!!Students will understand that patterns of association can also be seen in categorical data by displaying frequencies and relative frequencies in a two-way table. Construct and interpret a two-way table summarizing data on two categorical variables collected from the same subjects. Use relative frequencies calculated for rows or columns to describe possible association between the two variables.Please follow me to hear about new discounts, f
Subjects:
Grades:
8th - 10th
CCSS:

Distribution SOCS (Graphic Organizer)
When comparing and describing our boxplots, stemplots, histograms, dotplots, and other data displays it is vital that our students fully explain the differences and similarities in each distribution. SOCS (shaper, outlier, center, and spread) is a great acronym used to remember the four most important concepts that need to be discussed.This graphic organizer is a great tool to use as a warm-up or opener to a quiz or test. Or as an exit ticket to close our a lesson on comparing distributions.Al
Subjects:
Grades:
7th - 12th, Higher Education
CCSS:

Interactive Notebook Frequency Table Foldable
This foldable is a great way to review frequency tables. It can be used as a review prior to discussing two-way tables.
Subjects:
Grades:
6th - 9th
CCSS:
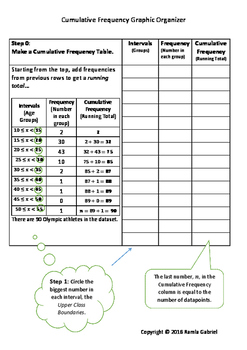
Cumulative Frequency Plot Graphic Organizer
This graphic organizer takes students step by step through the setup of a cumulative frequency table from their data and then the plotting of a cumulative frequency graph. Additionally, the third page of this organizer also walks students through finding the median and lower and upper quartiles from the cumulative frequency graph they created on the previous page (useful for making box plots). Examples are shown throughout. This organizer is useful for students new to the topic, struggling le
Subjects:
Grades:
6th - 12th, Adult Education
CCSS:
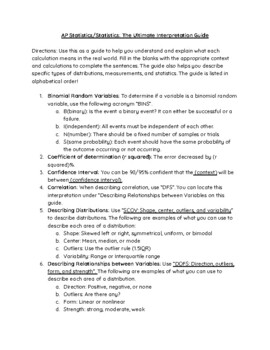
AP Statistics: Interpretations Guide: What does each statistic mean?
Hi teachers! This resource is great for your elementary, regular, or AP Statistics course. Students can use this guide all year long. We want our students to actually understand what they are calculating and connect their learning to real-world contexts! This resource will help them do just that. Some interpretations covered are mean, median, mode, and more. Here are the directions for use of the interpretations guide: Directions: Use this as a guide to help you understand and explain what each
Subjects:
Grades:
7th - 12th
CCSS:
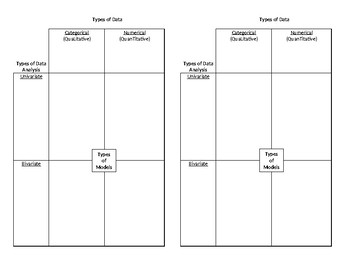
Intro to Data Analysis Graphic Organizer
I created this template for an introduction to my data analysis unit in Algebra I. We discuss and define categorical vs. numerical data, univariate vs. bivariate analysis, and the different graphs or models that apply to each. Since we use Interactive Notebooks, it is designed to be half a page.
Subjects:
Grades:
7th - 12th
CCSS:
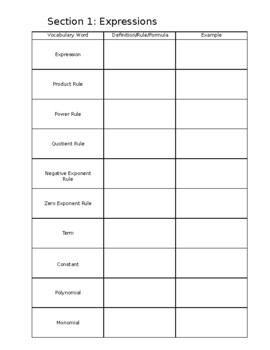
Algebra 1 EOC Vocabulary
Algebra 1 Vocabulary from each section. Completely edited. Answer key will be provided by 5/1.
Subjects:
Grades:
8th - 12th
Types:
CCSS:

Dr. Wimpey's Quick Reference for Statistics
I created this all-in-one document/foldable to help my statistics classes. It contains definitions, procedures, etc. It is useful for AP, honors, and CP levels in high school as well as college introductory statistics courses.
Subjects:
Grades:
11th - 12th, Higher Education
CCSS:
Showing 1-24 of 25 results

