4 results
Common Core HSS-ID.B.5 laboratories

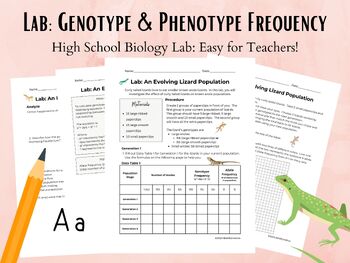
Lab: Genotype and Phenotype Frequency in Lizard Populations
This is a High School Biology lab where students will model changes in a populations traits. They will calculate genotype and phenotype frequency and monitor its changes over the course of 4 generations of lizards. Students will use A data table2 line graphthe Hardy Weinberg formula for genotype frequency Answer analysis questions. Teacher setup is minimal. Supplies are inexpensive and easily found in schools or at an office supply store. NGSS Standard CoveredLS3: Heredity: Inheritance and Var
Grades:
9th - 12th, Higher Education
Types:
CCSS:
NGSS:
HS-LS3-3

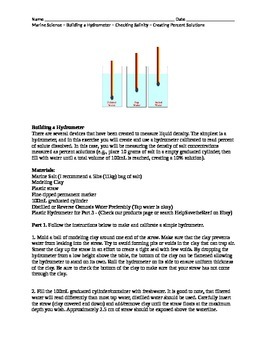
Marine Science Biology Making a Hydrometer Making Percent Solutions
This laboratory experience enables students to create a hydrometer using clay and straws to measure unknown solutions. Students begin by calibrating their devices using percent solutions that they must make. They can then use their device to measure unknown solutions provided by the instructor. Students are asked to convert units of measure. Additional research questions are provided that go beyond the laboratory activity.
Subjects:
Grades:
9th - 12th, Adult Education
Types:
CCSS:

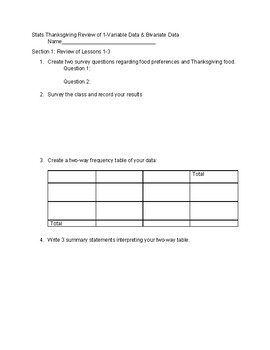
1-Variable & Bivariate Thanksgiving Data
Students will create survey questions to collect and analyze bivariate data from their classmates. Section 2 has students creating a scatterplot from given data and answering follow up questions. Section 3 is a review of 1-variable data, where students create a numerical data survey question to collect and analyze data from the class. Students should be familiar with 1-variable and 2-variable data to complete this assignment.
Subjects:
Grades:
9th - 12th
Types:
CCSS:

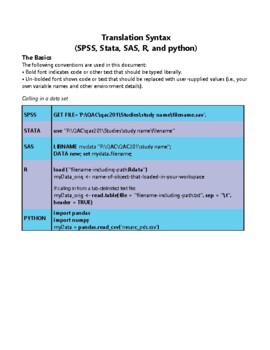
STATA software Secondary Data Analysis
This handout is intended for those interested in teaching/learning basic introductory statistics concepts to analyze real data. Students will learn how to tell a story using secondary data analysis. The handout is for STATA software and the US Longitudinal Study of Adolescent Health data set. For handouts on setting up an account, the data set code book and raw data file, a PowerPoint to accompany the handout, or questions please email kristin.flaming@gmail.com or ldierker@wesleyan.edu.This
Grades:
6th - 12th, Higher Education, Adult Education
Types:
Showing 1-4 of 4 results

