24 results
Common Core HSS-ID.A.1 independent work packets

Gr 9 Math Full Course Lessons, Assignments, Tests, and Answer Keys
Comprehensive Grade 9 Math Curriculum ResourcesWelcome to your one-stop destination for Grade 9 Math teaching materials, designed to align with the Manitoba curriculum standards. These resources encompass a full range of teaching and learning materials, crafted to support diverse learning paths within the Grade 9 classroom.What's Inside:Detailed Lesson Plans: Each lesson plan is structured to provide clarity and ease of use, ensuring that educators can seamlessly integrate these resources into
Subjects:
Grades:
9th, Adult Education
CCSS:
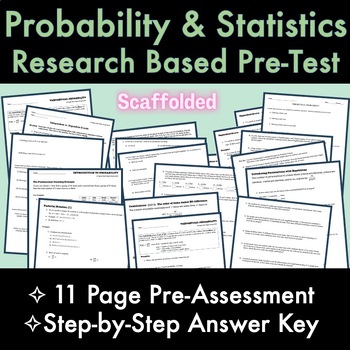
Statistics & Probability RESEARCH BASED 11-Page PreTest/PreAssessment with Key
87 qualified high school math teachers have been surveyed POST-COVID across the 6 subjects (algebra 1, algebra 2, geometry, precalculus, calculus, and statistics & probability). This 11-page research-based scaffolded statistics & probability pretest/ pre-assessment/ common assessment is a compilation of their answers to the question: what do you WISH students knew BEFORE taking the course? The assessment is scaffolded for students as well!---------------------------Check out my other res
Subjects:
Grades:
11th - 12th, Higher Education
CCSS:
Also included in: ALL HIGH SCHOOL MATH SUBJECTS Full PreTests with Keys - RESEARCH BASED
AP Statistics - 147 Google Form Companions for ALL AP Daily Videos
Do you require your students to watch the awesome AP Daily videos that College Board provides? Me too! But I needed a way to ensure the students were actually watching this resource and taking away all the valuable information they contain. These Google Forms allowed me to confirm that students were making the most of the AP Daily videos.This download contains 147 google forms. Each form is a companion to the 147 AP daily videos located in the AP Statistics course for all units from 1-9.
Subjects:
Grades:
9th - 12th
CCSS:
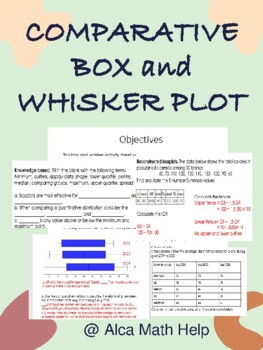
Comparison Box and Whisker Plots Worksheet, Quiz, Test for Stats & AP Stats
This box and whisker activity sheet was designed to test students understanding of the 5 number summary data values given quantitative data sets. Perfect for students in grade 10-12 doing statistics and you want to give them a challenge and should be manageable for students doing AP STATSAt the end of this activity students should be able to1. Students should be able to explain and construct box plots showing the different regions and what they represent. 2. Students should also be able to use
Subjects:
Grades:
11th - 12th, Higher Education, Adult Education, Staff
CCSS:

How to Use Desmos on Algebra 1 State Tests & EOC Exams PART 1
This is Part 1 of a 3 part series of lessons on using the Desmos graphing calculator to improve performance on Algebra 1 State Tests and EOC Exams.
Subjects:
Grades:
8th - 12th
CCSS:
Also included in: How to Use Desmos on Algebra 1 State Tests & EOC Exams

How to Use Desmos on Algebra 1 State Tests & EOC Exams PART 2
This is Part 2 of a 3 part series of lessons on using the Desmos graphing calculator to improve performance on Algebra 1 State Tests and EOC Exams.
Subjects:
Grades:
8th - 12th
CCSS:
Also included in: How to Use Desmos on Algebra 1 State Tests & EOC Exams
How to Use Desmos on Algebra 1 State Tests & EOC Exams PART 3
This is Part 3 of a 3 part series of lessons on using the Desmos graphing calculator to improve performance on Algebra 1 State Tests and EOC Exams.
Subjects:
Grades:
8th - 12th
CCSS:
Also included in: How to Use Desmos on Algebra 1 State Tests & EOC Exams
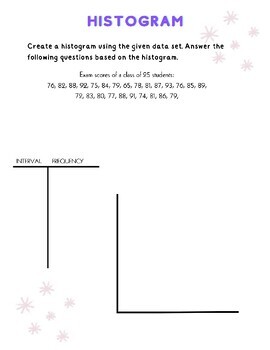
Histogram, Dot Plot, and Stem and Leaf Review Worksheet - with Answer Key
Introducing the "Exploring Data Distributions" Review Worksheet Pack - a comprehensive and engaging resource designed for middle school and high school students to master the concepts of histograms, dot plots, and stem-and-leaf plots. Answer key included and absolutely no prep required.This review worksheet is carefully crafted to provide students with a solid understanding of data distributions. It covers key topics such as creating and interpreting histograms, dot plots, and stem-and-leaf plo
Subjects:
Grades:
6th - 12th
CCSS:
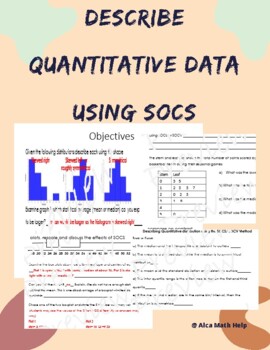
Describe Quantitative Data using SOCS/SOCV- Box plot, Histogram, Stem plot
If you are looking for a worksheet that can be used as a quiz, test, review packet you are at the right place. This activity sheet is suitable for students doing AP Stats and CP Probability and Statistics. This activity sheet allows students to:Use prior knowledge to answer true false questions and fill in the blanks with vocabulary provided.Describe box plots, histogram and stem plot using SOCS.Interpret the shape, center, outlier or any unusual feature along with the spread.
Subjects:
Grades:
11th - 12th, Higher Education, Adult Education, Staff
CCSS:
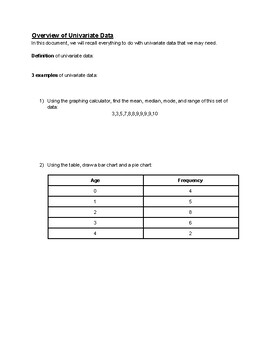
Univariate Data overview for IB Applications and Interpretations
Univariate data is usually already somewhat familiar to students in both SL and HL IB Applications and Interpretations. In this overview, students will review what they know, as well as have an opportunity to learn some simple skills that may be new to them. Everything is covered except for cumulative frequency: mean, median, mode, range, quartiles, IQR, grouped frequency tables, variance, standard deviation, box and whiskers plot, pie chart, bar chart, outliers.Students use some data gathered i
Subjects:
Grades:
10th - 12th
CCSS:
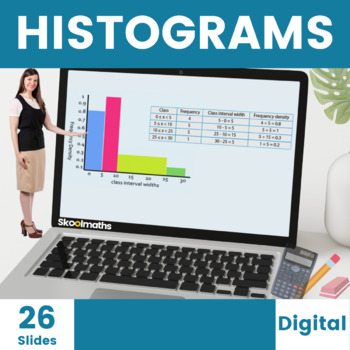
Histograms Digital Lesson for High School
Teach your High School students how to Interpret and Construct Histograms with unequal class intervals with these completely interactive digital home learning resources with engaging content and instant learner feedback. Buy this great value 26-page bundle of interactive histogram activities today to save you hours of planning and don't forget to leave an honest review if you download this worksheet for TPT credit :)Like this? You might also like...Conditional ProbabilityCalculating AveragesCond
Subjects:
Grades:
8th - 10th, Higher Education
CCSS:
Also included in: Complete Statistics and Probability Bundle | Digital and Print
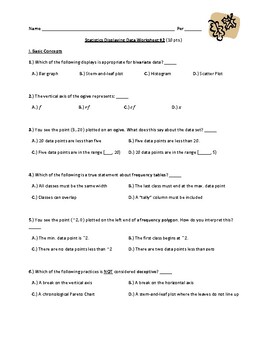
Displaying Data Worksheet #2
Review worksheet covering the following data displays: Bar graphs including Pareto charts, pie charts, dot plots, stem-and-leaf plots, frequency tables, histograms, frequency polygons, ogives, scatter plots, and time series graphs.That last page includes a review problem covering Stratification.This is the second of two review worksheets for Displaying Data. They can each be assigned individually, or together as a total review packet.
Subjects:
Grades:
11th - 12th, Higher Education
CCSS:
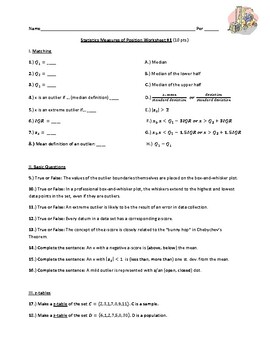
Measures of Position Worksheet #1
Review worksheet covering topics related to Measures of Position, including:1.) z-Scores2.) Fractiles (specifically Quartiles, Deciles and Percentiles)3.) Interquartile Range4.) Box-and-Whisker Plots5.) Outliers (using both the mean- and median-based definitions)There is also a problem asking students to recall concepts involving Measures of Central Tendency.This is the first in a series of four worksheets. They can each be assigned individually, or together as a total review packet.
Subjects:
Grades:
11th - 12th, Higher Education
CCSS:
AP Statistics - AP Daily Videos: Unit 1 Google Form Companions
Do you require your students to watch the awesome AP Daily videos that College Board provides? Me too! But I needed a way to ensure the students were actually watching this resource and taking away all the valuable information they contain. These Google Forms allowed me to confirm that students were making the most of the AP Daily videos.This download contains 14 google forms. Each form is a companion to the 14 AP daily videos located in the AP Statistics Unit 1: One Variable Data section.
Subjects:
Grades:
9th - 12th
CCSS:
Also included in: AP Statistics - 147 Google Form Companions for ALL AP Daily Videos
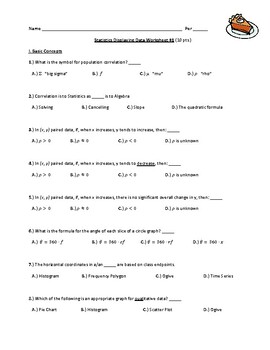
Displaying Data Worksheet #1
Review worksheet covering the following data displays: Bar graphs including Pareto charts, pie charts, dot plots, stem-and-leaf plots, frequency tables, histograms, frequency polygons, ogives, scatter plots, and time series graphs.This is the first of two review worksheets for Displaying Data. They can each be assigned individually, or together as a total review packet.
Subjects:
Grades:
11th - 12th, Higher Education
CCSS:
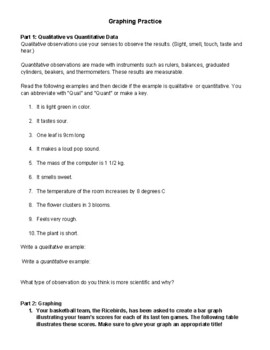
Graphing and Data Analysis Practice
A good practice for a high school science class after teaching students about different types of graphs and quantitative vs qualitative data. Can be used as an independent work packet in class or homework. Perfect for a remote assignment!
Subjects:
Grades:
8th - 12th
CCSS:
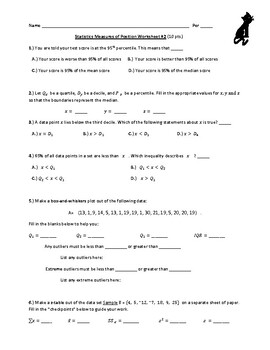
Measures of Position Worksheet #2
Review worksheet covering topics related to Measures of Position, including:1.) z-Scores2.) Fractiles (specifically Quartiles, Deciles and Percentiles)3.) Interquartile Range4.) Box-and-Whisker Plots5.) Outliers (using both the mean- and median-based definitions)The second page has problems from topics typically covered before Measures of Position in a Statistics course.This is the second in a series of four worksheets. They can each be assigned individually, or together as a total review packet
Subjects:
Grades:
11th - 12th, Higher Education
CCSS:
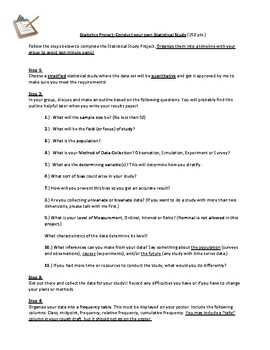
Statistical Study Project
Instructions for conducting a scientific statistical experiment in a school setting. Students will collect data, describe their data using a poster with tables and graphs, summarize their findings in a paper, and present their findings to the class.
Subjects:
Grades:
11th - 12th, Higher Education
CCSS:
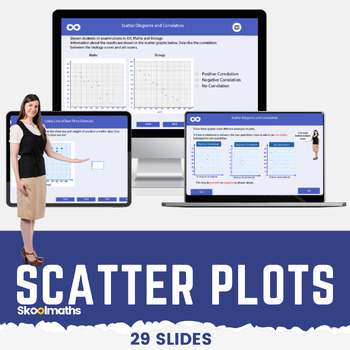
Scatter Plots | Correlation | Line of Best Fit Digital Math Lesson CCSS 8.SP.A.1
Scatter Plots | Correlation | Line of Best Fit Digital Math Lesson CCSS8.SP.A.1Want a high-engagement interactive math lesson that will teach your high school grade how to use and interpret scatter graphs; recognize correlation; draw and use lines of best fit to make predictions?In this lesson, learners will be able to:use and interpret scatter graphs of bivariate data;recognize different types of correlation;draw estimated lines of best fit; anduse lines of best fit to make predictions.The less
Subjects:
Grades:
8th - 10th
CCSS:
Also included in: Complete Statistics and Probability Bundle | Digital and Print
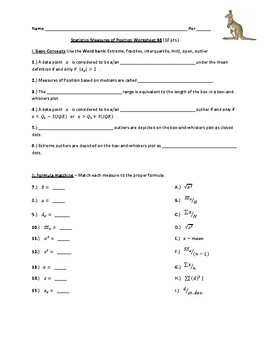
Measures of Position Worksheet #4
Review worksheet covering topics related to Measures of Position, including:1.) z-Scores2.) Fractiles (specifically Quartiles, Deciles and Percentiles)3.) Interquartile Range4.) Box-and-Whisker Plots5.) Outliers (using both the mean- and median-based definitions)This is the last in a series of four worksheets. They can each be assigned individually, or together as a total review packet.
Subjects:
Grades:
11th - 12th, Higher Education
CCSS:
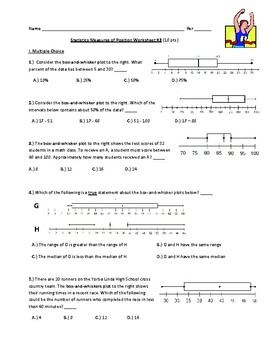
Measures of Position Worksheet #3
Review worksheet covering topics related to Measures of Position, including:1.) z-Scores2.) Fractiles (specifically Quartiles, Deciles and Percentiles)3.) Interquartile Range4.) Box-and-Whisker Plots5.) Outliers (using both the mean- and median-based definitions)The second page has a section of problems from topics typically covered before Measures of Position in a Statistics course.This is the third in a series of four worksheets. They can each be assigned individually, or together as a total r
Subjects:
Grades:
11th - 12th, Higher Education
CCSS:
Sampling and Statistics Take Home Packet
This packet can be used for many different needs. I am currently using this for virtual learning and giving it to students who need something different or more to understand the concepts. This resource is designed for supplemental instruction and can be used for reteaching, absent students, distance learning or additional practice. The topics included are: sampling methods, understanding changes in mean and median, interpreting box and whisker plots, interpreting histograms and interpreting stan
Subjects:
Grades:
8th - 11th
CCSS:

Flipped Classroom Homework Entrance Ticket Introduction to Quartiles
This is the perfect homework for a flipped classroom! Students are asked to watch the video and take notes. Then they are asked to upload a copy of their notes and answer a few “check for understanding” questions. This resource provides teachers with student accountability for notetaking and an exit slip all in one place. This helps to pave the way for the most effective in-class practice sessions possible. Here is a video description. https://youtu.be/rpXRSuewFw0
Subjects:
Grades:
7th - 9th
CCSS:

Video Game Themed HyperDoc - Data Visualization
This hyper doc is a review of Unit 1 for Integrated Math 1. This review covers box plots, bar charts, histograms, and dot plots. Common Core Standards: CCSS: S.ID.A.1CCSS: S.ID.A.2
Subjects:
Grades:
8th - 12th
CCSS:
Showing 1-24 of 24 results

