11 results
Common Core HSS-ID.A.1 laboratories
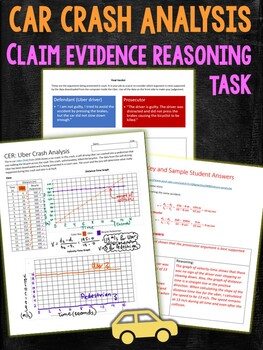
Self Driving Car Crash Analysis Claim Evidence Reasoning Task
In this task students will analyze a car accident which caused a fatality. Students will graph the distance-time data downloaded from a self-driving car. They will then determine the rate of change of distance, that is the velocity of the objects involved, and create a corresponding velocity-time graph. Finally students will construct a scientific explanation using the framework of claim-evidence and reasoning on whether the data supports the case of the prosecutor or the defendant.I used this w
Subjects:
Grades:
8th - 12th
Types:
CCSS:
NGSS:
HS-PS2-1
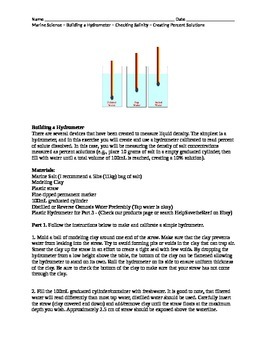
Marine Science Biology Making a Hydrometer Making Percent Solutions
This laboratory experience enables students to create a hydrometer using clay and straws to measure unknown solutions. Students begin by calibrating their devices using percent solutions that they must make. They can then use their device to measure unknown solutions provided by the instructor. Students are asked to convert units of measure. Additional research questions are provided that go beyond the laboratory activity.
Subjects:
Grades:
9th - 12th, Adult Education
Types:
CCSS:
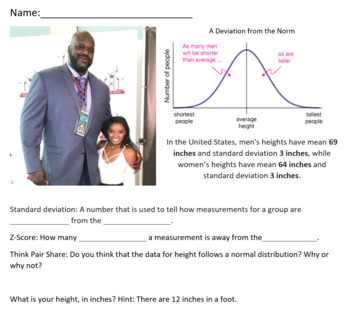
A Deviation From The Norm
This lesson teaches students how to apply information about normal distributions, means, standard deviations, and z-scores from real life data about height. The focus of this lesson is conceptual understanding; students will not be computing any standard deviations. However, they will use a given mean, standard deviation, and normal distribution to compute z-scores and percentiles for their own height, their classmates' heights, and celebrities' heights.
Subjects:
Grades:
9th - 12th
Types:
CCSS:
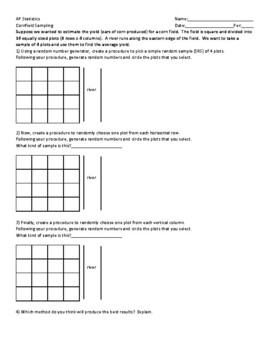
AP Statistics: Cornfield Sampling
This lab activity allows students to see results from different sampling methods and then determine why one method might be beneficial over another. Students also review organizing data into a graphical display. AP Statistics Unit 3: Collecting Data.
Subjects:
Grades:
10th - 12th
Types:
CCSS:
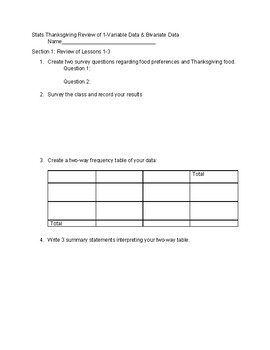
1-Variable & Bivariate Thanksgiving Data
Students will create survey questions to collect and analyze bivariate data from their classmates. Section 2 has students creating a scatterplot from given data and answering follow up questions. Section 3 is a review of 1-variable data, where students create a numerical data survey question to collect and analyze data from the class. Students should be familiar with 1-variable and 2-variable data to complete this assignment.
Subjects:
Grades:
9th - 12th
Types:
CCSS:
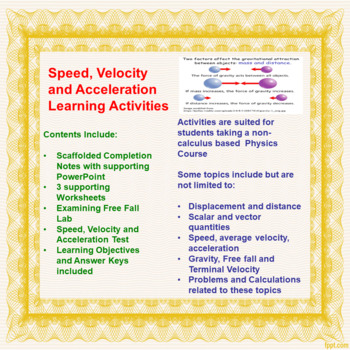
Speed, Velocity and Acceleration Learning Activities
This zip file contains many different activities (54 pages of student handouts and 1 PowerPoint with a total of 47 slides) which can be used to compose a unit for physics students involving topics involving Speed, Velocity and Acceleration. Topics in this unit include distance, displacement, scalar and vector quantities, speed, velocity, average velocity, acceleration, free fall, calculations involving these topics as well as many other concepts.A free fall lab activity is contained within this
Subjects:
Grades:
9th - 12th, Higher Education
CCSS:
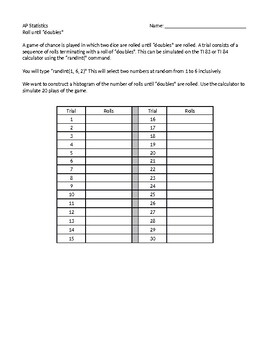
AP Statistics: Roll Until Doubles Activity
This is an experiment that has students simulate rolling two dice using their graphing calculators. They will collect their own data then organize and display the class set of data. Students will then attempt to draw conclusions about game theory based on the data collected. AP Statistics Unit 1: Exploring One-Variable Data. AP Statistics Unit 3: Collecting Data.
Subjects:
Grades:
10th - 12th
Types:
CCSS:
High School Physics - Mini Lab: Mapping Equipotential Surfaces
This quantitative, inquiry based laboratory exercise for physics classes examines the mapping of equipotential surfaces for a dipole charge configuration. Applicable to Physics, Honors Physics, and AP Physics classes.Instructor's Notes and Student Worksheets are included.This exercise covers portions of the following California State Science Standards:Physics - Vector Force FieldsInvestigation and ExperimentationPlease follow my store, The Physics Lab! Thank you!David Schalek is an award winning
Subjects:
Grades:
9th - 12th
Types:
CCSS:
AP Statistics: Simulation Lab Worksheet
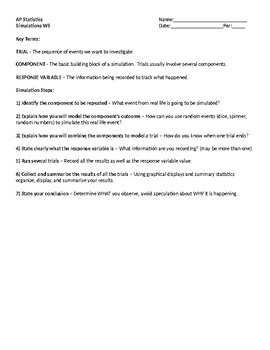
This activity provides the basics of creating and running a random simulation. There are key terms as well as a defined procedure to follow. The questions are scaffolded to assist in completion and the level of scaffolding decreases as the worksheet progresses. AP Statistics Unit 3: Collecting Data.
Subjects:
Grades:
10th - 12th
CCSS:
Earthworms Response to Temperature
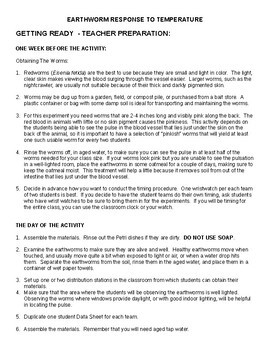
This is a lab for Middle School and High School Science classes. It uses Red Wigglers, Eisenia fetida, to manipulate temperature variables to affect the worm's pulse rate. Red Wigglers are easy to work with and allow students to see the blow flow through the closed circulatory system and calculate the pulse rate of the worm. This lab uses graphing and data collection to help students understand how science accumulates data to make inferences about how conditions affect animals.
STATA software Secondary Data Analysis
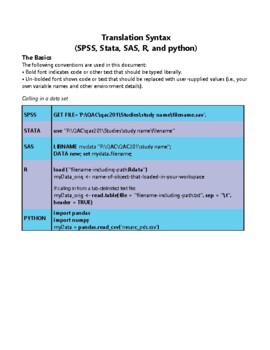
This handout is intended for those interested in teaching/learning basic introductory statistics concepts to analyze real data. Students will learn how to tell a story using secondary data analysis. The handout is for STATA software and the US Longitudinal Study of Adolescent Health data set. For handouts on setting up an account, the data set code book and raw data file, a PowerPoint to accompany the handout, or questions please email kristin.flaming@gmail.com or ldierker@wesleyan.edu.This
Grades:
6th - 12th, Higher Education, Adult Education
Types:
Showing 1-11 of 11 results

