16 results
Common Core HSS-ID.A.1 internet activities
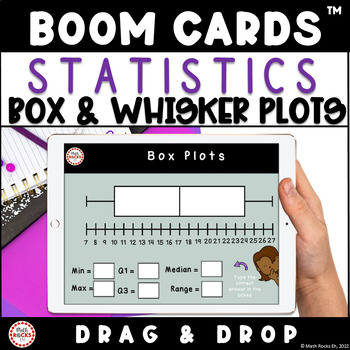
Box and Whisker Plots Activity Statistics Data Sets Math Digital Boom Cards™ 8th
Introduce your 8th grade students to box and whisker plots with this drag and drop and fill in the blanks digital Boom Cards activity. Students will analyze four sets of data drag and drop slides to review statistics terminology by placing the correct word or term in the space provided under the box whisker plot. Next, students will fill-in-the-blanks on six box-whisker plots by reading the number line to get the correct answer. Students will locate min, max, Q1, Q3, median and range.Aligns with
Subjects:
Grades:
6th - 9th
Types:
CCSS:
Also included in: MTH1W Grade 9 Math Activities Algebra 1 Digital Boom Cards™ MEGA Bundle
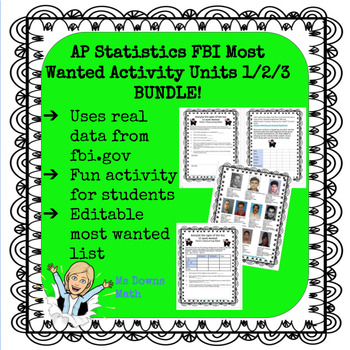
FBI Most Wanted AP Stat - Analyze Data, Normal Distributions, Linear Regression
I have created a series of activities for several units in the AP Statistics curriculum. The students love using data from fbi.gov to review concepts. This activity involves analyzing data related to the top 10 most wanted fugitives. I created this activity in May of 2020 and used the top 10 at that time. In the folder, you will find an editable slide of the top 10 if you want to change it.The answer key for the unit is based on the original top 10 that I used. Teachers have the option of having
Subjects:
Grades:
10th - 12th
Types:
CCSS:
TPC MAAP Alg 1 - Practice Set #3
This test is an abbreviated practice set for the MAAP (Mississippi) Algebra 1 2024 assessment. This set was developed to mirror some of the of the Algebra 1 test items on the official practice site.All of the items in the set were created for students to practice using the Mississippi Testing version of the Desmos graphing calculator.The official Mississippi department of education blueprints, reference sheets and test specifications can be found at the MDE website.Even though this test was spec
Grades:
7th - 10th
Types:
CCSS:
Also included in: TPC MAAP 2024 Algebra 1 Bundle
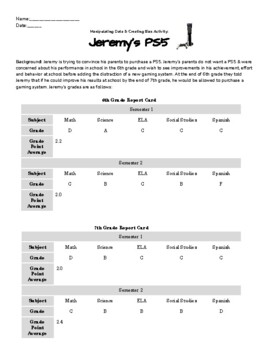
Manipulating Data & Creating Bias Activity
Manipulating Data & Creating Bias Activity: Teach your students about how charts and statistics can be skewed; and real numbers can reflect bias with this fun project! Students are given a role (either Jeremy or his parents) and have to use two pieces of data from Jeremy's 6th & 7th grade report card to argue for or against his deserving of a PS5!Students get to be creative & make cross-curricular connections to ELA as they use logical fallacies & skewed graphs to make their argu
Subjects:
Grades:
4th - 11th
Types:
CCSS:
NGSS:
HS-ETS1-4
FREE EDUCATIONAL WEBSITES LIST 4 ALL GRADES K-12 AND SUBJECTS + TEACHER RESOURCE
Sometimes, you just need a list of websites for everyone. Here it is. FREE EDUCATIONAL WEBSITES Put together by Teach Me, Maria!It takes time to gather this information, figure out the appropriate grade levels, and format, maintain, and update this page. All I ask is for an honest review if this list helps you.
Subjects:
Grades:
PreK - 12th, Staff
Types:
TPC GMAS (Georgia) 2024 Algebra 1 Practice Set #1
Learn how to use the official Desmos Graphing Calculator for the Georgia Milestones Assessment for Algebra 1.The items in this practice set are modeled after the items that appear in the official Georgia Online practice test.For the best results, follow these guidelines.Students will need a device and internet access and should...1. Access the items from the GMAS training site. Georgia Milestones Online Training Tools Site.2. View the accompanying YouTube Videos as they work through select item
Grades:
7th - 10th
Types:
CCSS:
Also included in: TPC #GMAS Algebra 1 Bundle
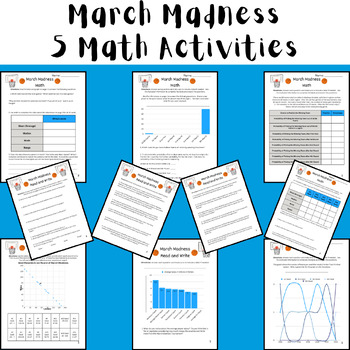
March Madness Men's Math - 5 Activities (Data + Graphs) Printable & Digital 2024
These 5 activities are fun NO PREP math activities to do to celebrate March Madness! The activities can be completed as 5 separate activities, stations, or as a multi-page packet. There is a fully customizable digital resource (Canva Template) and a printable resource (Canva) that contain the same directions and activity for each resource. This was designed for students in middle school, but could be used for upper elementary and high school students in Pre Algebra, Pre-Algebra, or Algebra.In th
Subjects:
Grades:
3rd - 12th
Types:
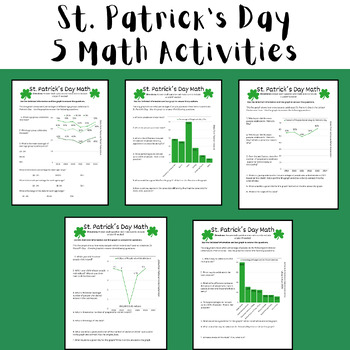
St. Patrick's Day Math Activities (Test Prep Data Analysis) Printable or Digital
These 5 activities are fun NO PREP math activities to do to celebrate St. Patrick's Day. The activities can be completed as 5 separate pages or as a 5 page packet. There is a customizable digital resource (Canva Template) and a printable resource (Canva) that contain the same directions and activity. This was designed for students in middle school, but could be used for upper elementary and high school students in Pre Algebra, Pre-Algebra, or Algebra.In this assignment, students are asked to:Gra
Subjects:
Grades:
3rd - 12th, Staff
Types:
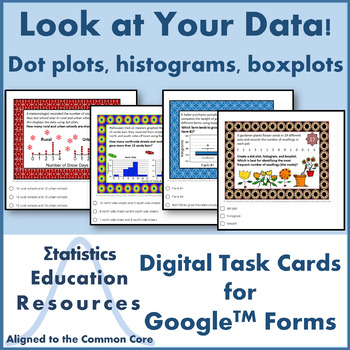
Digital Task Cards for Dot Plots, Histograms, Boxplots
Distance Learning: Look at Your Data! Digital Task Cards for Dot Plots, Histograms, and Boxplots (Common Core)These digital task cards are adapted from the printable version of the Look at Your Data! Task Cards available here. This product includes 20 self-grading digital task cards created with Google™ Forms:4 task cards on dot plots4 task cards on histograms8 task cards on boxplots and five-number summaries4 task cards that integrate and compare different types of graphical displays These digi
Subjects:
Grades:
8th - 12th
Types:
CCSS:
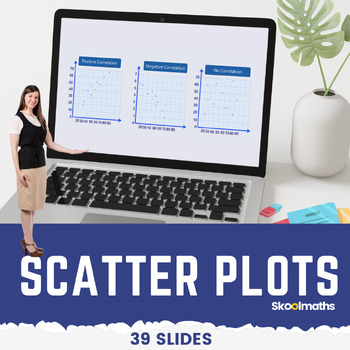
Eight Grade Scatter Plots Digital Math Lesson and Activities CCSS 8.SP.A.1
Eight Grade Scatter Plots Digital Math Lesson and ActivitiesTeach your high school grade how to use and interpret scatter graphs; recognize correlation; draw and use lines of best fit to make predictions?In this lesson, learners will be able to:use and interpret scatter graphs of bivariate data;recognize different types of correlation;draw estimated lines of best fit; anduse lines of best fit to make predictions.
Subjects:
Grades:
8th - 10th, Staff
Types:
CCSS:
AP stats Unit 1 review jeopardy-style game
Included in purchase is the answer key in order (Category 1 $100-500, category 2 $100-500, etc.) and the link to the jeopardy game website. Membership is not needed to play on the website, but you will need to upgrade to pro on their site if you want the buzzer mode (not necessary but fun if your students are very competitive) follows Unit one vocab and example problems of AP Statistics (Categorical and quantitative data, normal curve)
Subjects:
Grades:
11th - 12th
Types:
CCSS:
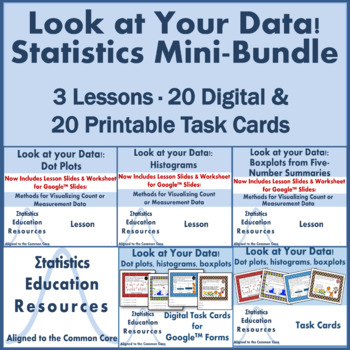
Look at Your Data! Mini-Bundle (Dot Plots, Histograms, Boxplots) (Common Core)
Update: Lesson slides and editable interactive worksheets now available in digital format for Google™ Slides! The digital version of the task cards created with Google™ Forms are now added to this bundle!Look at Your Data! Mini-Bundle (Common Core Aligned) This product is a bundle that includes 3 Common Core-Aligned lessons, 20 printable task cards with recording sheet and answer key, and 20 digital self-grading task cards (digital version in Google™ Forms of the printable task cards). Each les
Subjects:
Grades:
8th - 12th
Types:
CCSS:
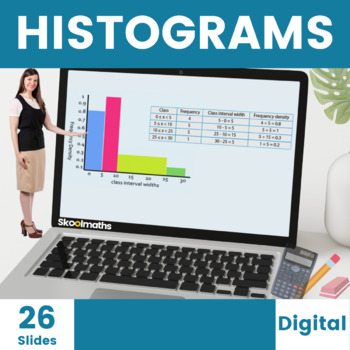
Histograms Digital Lesson for High School
Teach your High School students how to Interpret and Construct Histograms with unequal class intervals with these completely interactive digital home learning resources with engaging content and instant learner feedback. Buy this great value 26-page bundle of interactive histogram activities today to save you hours of planning and don't forget to leave an honest review if you download this worksheet for TPT credit :)Like this? You might also like...Conditional ProbabilityCalculating AveragesCond
Subjects:
Grades:
8th - 10th, Higher Education
CCSS:
Also included in: Complete Statistics and Probability Bundle | Digital and Print
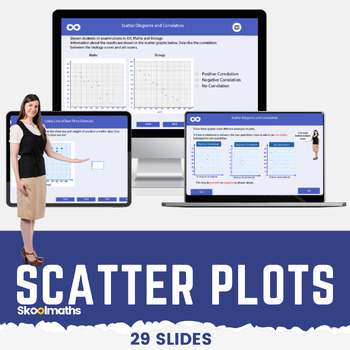
Scatter Plots | Correlation | Line of Best Fit Digital Math Lesson CCSS 8.SP.A.1
Scatter Plots | Correlation | Line of Best Fit Digital Math Lesson CCSS8.SP.A.1Want a high-engagement interactive math lesson that will teach your high school grade how to use and interpret scatter graphs; recognize correlation; draw and use lines of best fit to make predictions?In this lesson, learners will be able to:use and interpret scatter graphs of bivariate data;recognize different types of correlation;draw estimated lines of best fit; anduse lines of best fit to make predictions.The less
Subjects:
Grades:
8th - 10th
CCSS:
Also included in: Complete Statistics and Probability Bundle | Digital and Print
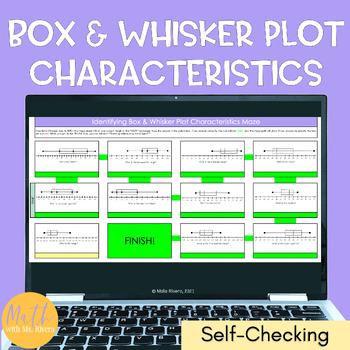
Characteristics of Box and Whisker Plots Digital Maze Activity for Pre-Algebra
Your students will complete 11 problems to practice identifying characteristics of box and whisker plots. The problems include identifying range, median, upper quartile, lower quartile, maximum value, minimum value, and interquartile range. If they answer correctly, a path will turn green and take them to the next problem. If they get it wrong, the path and the answer block will turn red.Your students will love this digital maze activity! This is an engaging activity for your students that requi
Subjects:
Grades:
7th - 9th
CCSS:
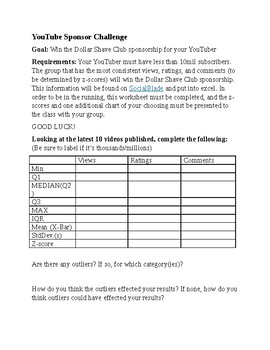
Youtube 5 Number Summary Challange
Students have to use statistical knowledge to win this challenge using their favorite youtubers statistics. Meets standards: HSS-ID.A.1HSS-ID.A.2HSS-ID.A.3HSS-ID.A.4CCRA.SL.1CCRA.SL.2CCRA.SL.4CCRA.SL.5
Subjects:
Grades:
10th - 12th, Higher Education, Adult Education
Types:
CCSS:
Showing 1-16 of 16 results

