31 results
Common Core HSS-ID.A.1 centers
Data Analysis and Statistics in Algebra 1 Google Forms Homework and Assessment
This Algebra 1 Google Forms bundle currently includes auto-grading assignments on the following skills related to data analysis and statistics:Measures of Central TendencyDot Plots and HistogramsBox PlotsStandard Deviation and The Empirical RuleTwo-Way Frequency TablesScatter PlotsEach assignment also includes a PDF "worksheet" for students to complete along with the form.All of the assignments in this bundle are also included in my:★ Algebra 1 (Semester 2) Google Forms BundleYou may also be int
Subjects:
Grades:
6th - 9th
CCSS:

Climate Change Graphing Activity
Students graph the changes in average global temperature over time, and then analyze, predict, and explain the significance of climate change on the Earth and its people.Students read info related to climate change, then create a graph of average global temperature changes over the past 140 years. Students are then to answer several analysis questions, which could also be used to drive a meaningful classroom discussion about climate change.Included is a teacher's key which shows what the resulti
Subjects:
Grades:
5th - 11th
Types:
CCSS:
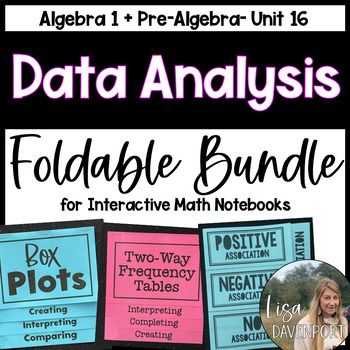
Data Analysis and Statistics Foldable Bundle
This foldable bundle includes skills associated with data and statistics taught within middle school math or algebra 1 standards:Mean, Median, Mode, RangeComparing CentersBox PlotsDot PlotsDisplaying Numerical DataAssociation within Scatter PlotsScatter PlotsWriting an Equation for a Trend LineStandard Deviation + The Empirical RuleData + Statistics in Algebra 1 Overview (Dot Plots, Histograms, Box Plots, + Two-Way Frequency TablesDetailed answer keys are included for each foldable.All of these
Grades:
7th - 10th
CCSS:
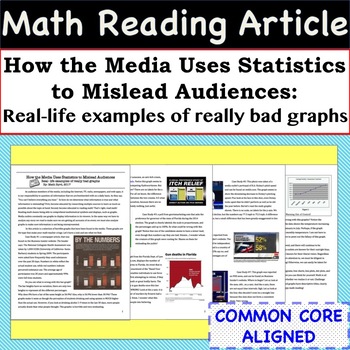
Statistics Math Article - Case Studies of Bad Graphs found in the Media
Incorporate Reading & Writing into the Math Classroom with this article and accompanying worksheet! The 4 page article is entitled - "How the Media Uses Statistics to Mislead Audiences: Real- life examples of really bad graphs". The worksheet helps students summarize the case studies and the article as a whole. This resource can be used in so many ways, some ideas are: station activity, independent reading assignment, small group activity, homework assignment, or whole class discussion.Skill
Subjects:
Grades:
8th - 11th
CCSS:
Also included in: Common Core Algebra 1 MATH READING ARTICLES - BUNDLE PRICE!
Data and Statistics Activity Bundle | Dot plot, Histogram, & Box Plot Activities
This Data and Statistics Activity Bundle for Algebra 1 includes activities to support mean, median, mean average deviation, standard deviation, dot plots, histograms, box plots, and two-way tables.These hands-on and engaging activities are all easy to prep! Students are able to practice and apply concepts with these data and statistics activities, while collaborating and having fun! Math can be fun and interactive!Standards: CCSS (S.ID.1, S.ID.2, S.ID.3, S.ID.5) More details on what is included:
Grades:
8th - 9th
Types:
CCSS:
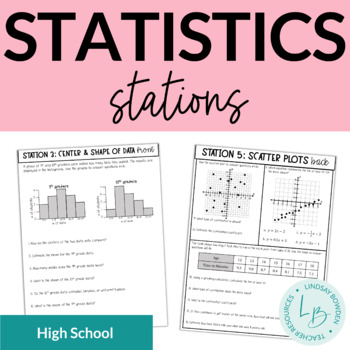
Statistics Stations
These statistics stations have 5 front and back stations that cover:histograms and dot plotstwo-way frequency tablescenter and shape of data (central tendency, peaks, symmetrical or skewed)spread of data (range, IQR, MAD)scatter plots (correlation, line of best fit, linear regression)Includes a student answer sheet and answer keys!Check out my YouTube video on stations here!You may also like:Box and Whisker Plots Notes & WorksheetsHistograms Notes & WorksheetsScatter Plots Notes and Work
Subjects:
Grades:
8th - 10th
Types:
CCSS:
Also included in: Statistics Unit Bundle
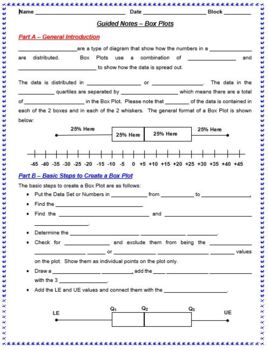
Guided Notes - Statistics Bundle (Box, Line & Scatter Plots, Histograms, Etc.)
This MS Word file is a bundle of 6 separate Guided Notes documents that review both the concept and steps involved in various statistical measures, plots and diagrams. The following Guided Notes documents are included in this bundle:Box PlotsLine PlotsHistogramsMeasures of Central TendencyScatterplots and Line of Best FitScatterplots and CorrelationThese individual Guided Notes documents have been bundled together to provide teachers with a single, complete, discounted package of 6 of the basic
Subjects:
Grades:
8th - 11th
CCSS:
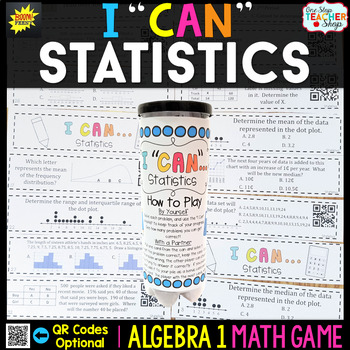
Algebra 1 Game | Statistics
Statistics have never been this much fun! This Algebra 1 I Can Math Game focuses on statistics, and provides students with practice in the form of multiple choice or short answer questions. QR codes (optional) make this game even more interactive as students get immediate feedback on their work with self-checking! This game can also be used for independent practice, small group activity, whole group review, or for progress monitoring. The possibilities are endless.With QR Codes!Here is a list o
Subjects:
Grades:
8th - 10th
Types:
CCSS:
Also included in: Algebra 1 Games BUNDLE - Math Test Prep Review
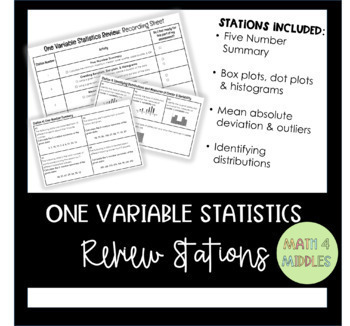
One Variable Statistics: Stations Review
Stations are a great way for students to practice skills or review for an upcoming assessment! Use this resource for your Algebra 1 students to review everything about one variable statistics.Station Topics Included:Five-Number SummaryCreating Boxplots, Dot plots, & HistogramsMean Absolute Deviation & OutliersIdentifying DistributionsTerms of Use:This product should only be used by the teacher who purchased it. This product is not to be shared with other teachers. Please buy the correct
Subjects:
Grades:
9th
Types:
CCSS:
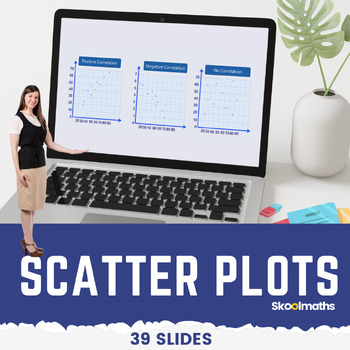
Eight Grade Scatter Plots Digital Math Lesson and Activities CCSS 8.SP.A.1
Eight Grade Scatter Plots Digital Math Lesson and ActivitiesTeach your high school grade how to use and interpret scatter graphs; recognize correlation; draw and use lines of best fit to make predictions?In this lesson, learners will be able to:use and interpret scatter graphs of bivariate data;recognize different types of correlation;draw estimated lines of best fit; anduse lines of best fit to make predictions.
Subjects:
Grades:
8th - 10th, Staff
Types:
CCSS:
Statistics - Algebra Math Workshop Math Games Stations
Are you looking for Math Workshop Activities to use in your Algebra classroom for Statistics that will allow you to make the best use of your planning time and easily implement Math Workshop stations because the planning is already done for you?**Want to know more? Check out the video here to learn more about the Math Workshop Concept-Based Activities!**Within this Weekly Unit, you will find 8 activities provided for you to pick and choose, or even allow a choice among your students to determine
Subjects:
Grades:
8th - 9th
Types:
CCSS:
Also included in: 7th, 8th & Algebra Grade Math Workshop Bundle Math Stations Now®️ Games
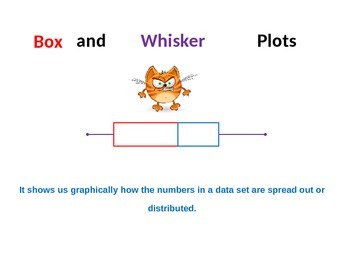
Box and Whisker Plot Analysis and Construction including Outliers
I use this MS PowerPoint presentation file to kickoff our study of Box Plots in my Pre-Algebra and Math I classes. It reviews in detail how to analyze a data set and to construct a Box Plot to accurately depict the distribution of the data (numbers). It is a totally animated ppt file and very easy for students to understand. Any of the ppt animations can be modified as desired by the presenter (teacher). It also includes 2 example problems for the students to complete at the end of the slid
Subjects:
Grades:
7th - 9th
CCSS:
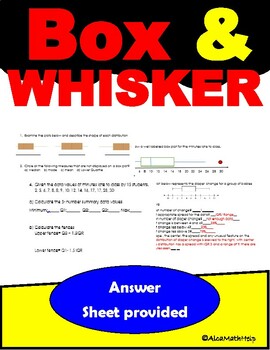
Statistics Quantitative Data Boxplots- 5 Number Summary Data CP, AP Stats
If you are looking for an activity sheet that will engage students as they aim to practice and apply taught concept this box plot activity is the one. It is excellent if you want to check students understanding while having fun. This activity helps students to describe the shape of quantitative distribution, identify centers and spreads by analyzing quartiles (measure of center and variability) . Use the SOCS method to describe the shape, center, spread and outlier as well as other unusual feat
Subjects:
Grades:
7th - 12th, Higher Education, Adult Education
Types:
CCSS:
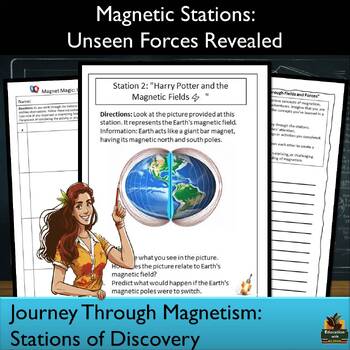
Physical Science Magnetism: Stations for High School with Digital Included!
Hello there! Let me tell you about this fantastic resource I've created to help you teach Magnetism in a way that's engaging, interactive, and super low-prep. Introducing the "Magnetism Stations: High School Physical Science Lesson" Here's what you'll get when you grab this set of resources: Engaging Stations: Capture your students' attention with 8 activities designed to help them explore and master Magnetism. (Ferromagnetism, Electromagnet, Magnetic Field, and more) Digital Version Include
Subjects:
Grades:
9th - 12th
Types:
CCSS:
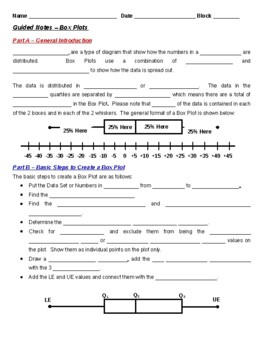
Guided Notes - Box Plots (Student & Teacher Versions)
This MS Word file is a Guided Notes document that reviews both the concept and steps involved in solving and producing Box Plots. I use these notes with my Math 1, Math 2 and Algebra 1 students immediately after I introduce this concept with my PPT presentation slidepack on the same subject. It is 2 full pages of notes for the students to complete and includes the detailed steps that I teach my students to use to solve and produce Box Plots. The 3rd page includes an example problem that is wo
Subjects:
Grades:
8th - 10th
CCSS:
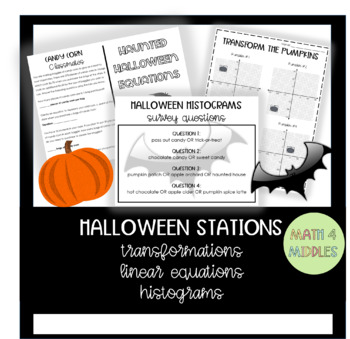
Halloween Stations: Transformations, Linear Equations, and Histograms
Looking for a fun, engaging activity for your students to do on Halloween this year? These stations include a variety of activities for your students to review! You can choose to have students complete 1 or all 3 of the activities included.The 3 stations included are:#1: Transform the Pumpkins (translate, rotate, reflect, and dilate)#2: Haunted Halloween Equations (writing linear equations, solving for “y” in equations, answering questions about a given word problem)#3: Halloween Histograms (sur
Subjects:
Grades:
7th - 9th
Types:
CCSS:
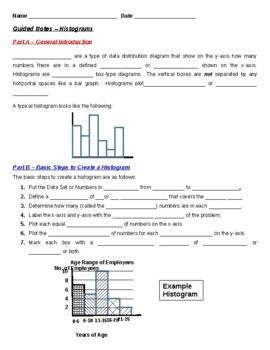
Guided Notes - Histograms (Student and Teacher Versions)
This MS Word file is a Guided Notes document that reviews both the concept and steps involved in developing Histograms. I use these notes with my Math 1, Math 2 and Algebra 1 students immediately after I introduce this concept with my PPT presentation slidepack on the same subject. It is 1-1/2 pages of notes for the students to complete and includes the detailed steps that I teach my students to use to properly develop and analyze Histograms. The 2nd page also includes an example problem that
Subjects:
Grades:
8th - 10th
CCSS:

Somebody Saw Logic Puzzles, Bella & Rachel - The Case of the Pilfered Answer Key
Intermediate Level:
Lizzy was just trying to eat lunch. Someone planted a stolen answer key in her back pack. Now Lizzy is in trouble.
Join Bella and Rachel to analyze the clues and solve the crime.
What Makes a Student a Creative Genius:
1. Creative geniuses love puzzles. Tomorrow’s innovators need:
Imagination to approach tough problems and design new lines of attack.
Somebody Saw Logic Puzzles develop logical reasoning and deduction skills.
• Creative geniuses aren’t correct
Grades:
1st - 9th
CCSS:
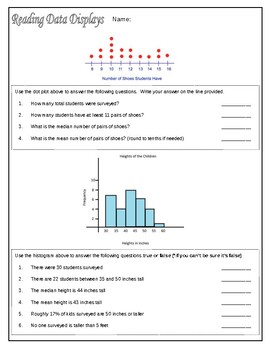
Reading Data Displays
Students are required to read dot-plots, histograms, and box and whisker plots to come to conclusions about data based on the given information. They must assess if they can truly know certain facts given the limitations of each form of data display.
Subjects:
Grades:
9th
Types:
CCSS:
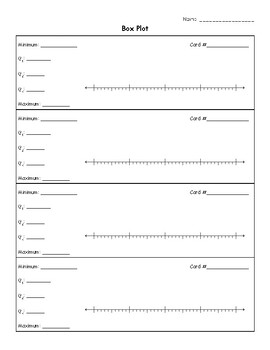
Creating box and whisker plots Card Activity
This low-prep set includes 16 cards that are perfect for practice. With minimal prep required, your students will practice and build these skills in a fun, engaging and out-of-their seat activity perfect for supplementing any lesson. 16 Cards 1 recording sheets Answer KeyYour students will love reinforcing their knowledge of box and whisker plots while they are out of their seats and having fun. They will be moving around and you will be keeping math fun! No additional materials are needed, bu
Subjects:
Grades:
6th - 9th
Types:
CCSS:
10 Free Big Brain Math Problems
This is a sample of the 100 and 180 Big Brain Math Problem I have created with a couple of my students. I write these problems on the window of my classroom everyday and get about 5-10 students a day coming to try to solve them. It's been an enjoyable experience to have students come try the problem of the day and share their solutions with me. Please consider purchasing the 100 or 180 Big Brain Math Problems. There's enough for one a day for the entire school year and range from 1-5 Star diffic
Subjects:
Grades:
9th - 12th
Types:
CCSS:
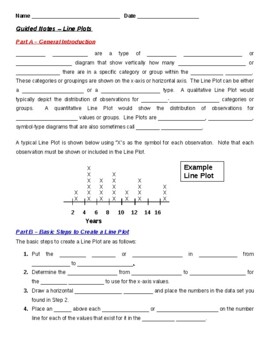
Guided Notes - Line Plots (Teacher and Student Versions)
This MS Word file is a Guided Notes document that reviews both the concept and steps involved in developing Line Plots. I use these notes with my general 8th Grade Math, Math 1, Math 2 and Algebra 1 students immediately after I introduce this concept with my PPT presentation slidepack on the same subject. It is 1-1/2 pages of notes for the students to complete and includes the detailed steps that I teach my students to use to properly develop and analyze Line Plots. The 2nd page also includes
Subjects:
Grades:
8th - 10th
CCSS:
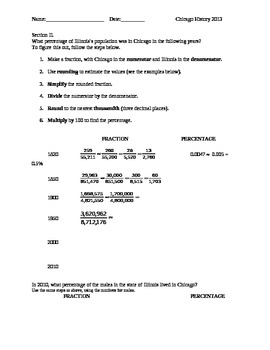
Census Data Analysis: Fractions, Percents, Rounding, Estimation, Graphing
Students practice graphing skills (you may have to edit the directions for the graph - we have bizarre graph paper at our school that required an extra step), and data manipulation. They work with fractions, percentages, rounding, and estimation.
Subjects:
Grades:
9th - 12th
Types:
CCSS:
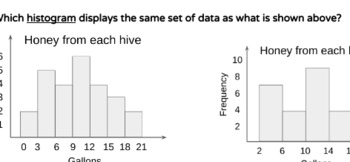
Histogram Formative Task
Formative Task<> This should be given to students PRIOR to any formal instruction on histograms. They attempt to develop their own set of steps for constructing a histogram.<> Students should already be familiar with dot plots. I recommend you have students construct a dot plot with the given data (as an opener or warm up) before handing out the formative task.<> The answer to #1 "which histogram?" is "ALL of them!" That can lead to a helpful discussion regarding choices (# of
Subjects:
Grades:
7th - 12th, Higher Education, Adult Education
Types:
CCSS:
Showing 1-24 of 31 results

