1,483 results
High school Easter statistics handouts
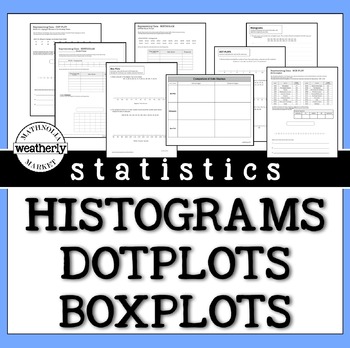
STATISTICS - Histograms, Dot Plots and Box Plots
There is no need to scour the internet for data. This resource includes the data and the format to challenge your students' skills with data displays.This packet includes worksheets that provide opportunities for students to create histograms, dot plots, and box plots.They can be used as guided practice or as "on your own" activities.INCLUDES3 worksheets with realistic data.3 worksheets with REAL data (Apple stock prices, US Olympic athlete ages, and the Oscars:Best Picture/ Movie Times)AND 3 wo
Subjects:
Grades:
6th - 9th
Types:
CCSS:
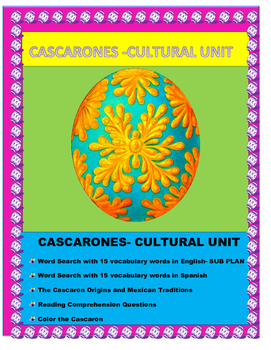
LOS CASCARONES DE PASCUA- Spanish Easter Reading English- SUB PLAN
This wonderful Cascarones Cultural unit is the perfect SUB plan before or after Easter break. Cascarones are eggs filled with confetti. A tradition that originated in Europe and that was brought to Mexico by Empress Carlotta , Emperor Maximilian's wife. This unit addresses, the origin, traditions and uses of Cascarones both in Mexico and in the Southwest in United States.
The unit contains:
CASCARONES- CULTURAL UNIT
Word Search with 15 vocabulary words in
English- SUB PLAN
Word Search
Subjects:
Grades:
3rd - 11th
Also included in: LA PRIMAVERA- SPANISH SPRING BUNDLE-Distance Learning Option
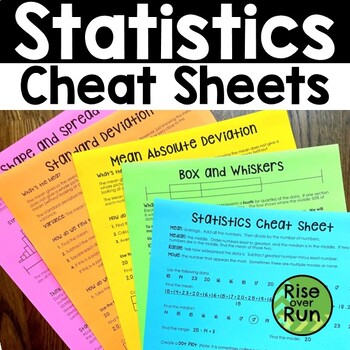
Statistics Cheat Sheets Notes with MAD, Standard Deviation, Shape & Spread
Grab these guided notes and "cheat sheets" to help your students understand statistics standards from Algebra I. Included Topics: Statistics Basics (mean, median, mode, range, dot plots, histograms, stem and leaf plots) Box and Whiskers Mean Absolute Deviation Standard Deviation Shape and Spread (Skewed Left and Skewed Right) The set includes each topic in the format of a cheat sheet and guided notes. The cheat sheets already have all the information filled in. They can be printed and given
Subjects:
Grades:
9th - 10th
Types:
CCSS:
Also included in: Algebra 1 and 8th Grade Math Curriculum Bundle for Entire Year
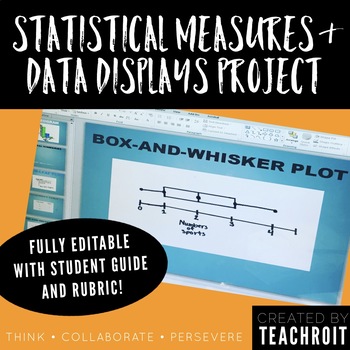
Statistics & Data Display Project for 6th Grade Math PBL (Fully Editable)
This product includes a student guide for a 6th grade middle school mathematics project that will require students to develop a statistical question, conduct a survey with their classmates, create numerical summaries, represent their findings using visual data displays, and finally present their findings! The thorough student guide provides step by step directions for each part of the project and could be used as either an in class project or to be assigned as homework. The student guide also in
AP Statistics Doodle Review Bundle
This Doodle Review Bundle would be great to review for the AP Exam before diving into practice problems. Have students fill in main ideas to help them remember what was taught earlier in the school year! An answer key is included. These Doodle Reviews are based on the chapters of TPS5e and are not aligned to the College Board CED. This Bundle includes the following Doodle Reviews:1 - One Variable Data2 - Density Curves3 - Two Variable Data4 - Designing Studies5 - Probability6 - Random Variables7
Subjects:
Grades:
11th - 12th
Types:
Goldie’s AP® Statistics UNIT 6 PLANS – Inference for Proportions
AP® Statistics Unit 6 – Inference for Categorical Data: ProportionsUnit BundleThis unit contains everything you need to teach "Inference for Categorical Data: Proportions" in AP® Statistics or regular-level Statistics. Students will go through how to justify conditions, calculate, interpret, and justify a claim about a confidence interval for a population proportion; identify the relationships between sample size, the width of a confidence interval, confidence level, and margin of error for a po
Subjects:
Grades:
10th - 12th
Types:
CCSS:
Also included in: Goldie's FULL CURRICULUM for AP® Statistics
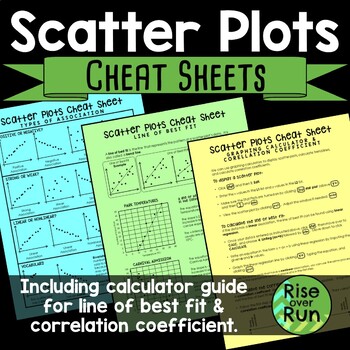
Scatter Plot Cheat Sheets Printable Guided Notes
Detailed sheets for the following topics: •Types of Association & VocabularyThis page shows examples of positive, negative, strong, weak, linear, and nonlinear association. It also shows clusters and outliers.•Line of Best FitThis page explains what a line of best is (or trend line) along with examples and nonexamples. It has 2 real world connections and how to interpret the line of best fit.•Graphing Calculator Guide & Correlation CoefficientThis sheet gives step by step instructions fo
Subjects:
Grades:
8th - 9th
CCSS:
Also included in: 8th Grade Math Activities & Lessons Bundle for the Whole Year
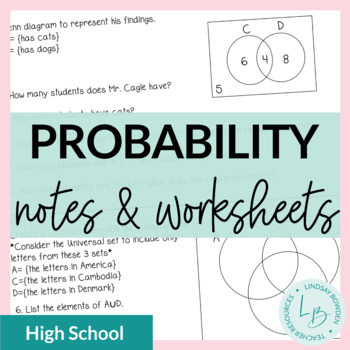
Probability Guided Notes and Worksheets
These probability notes and worksheets cover all of the compound and conditionality probability standards for high school. Topics covered: set theory (union, intersection, complement, Venn diagrams) outcomes and basic probability (coins, dice, tree diagrams, Fundamental Counting Principle)compound probability (addition and multiplication rules) conditional probability (both independent and dependent) Students must have a basic knowledge of a standard deck of playing cards to complete some of the
Subjects:
Grades:
9th - 11th
Types:
CCSS:
Also included in: Probability Unit Bundle
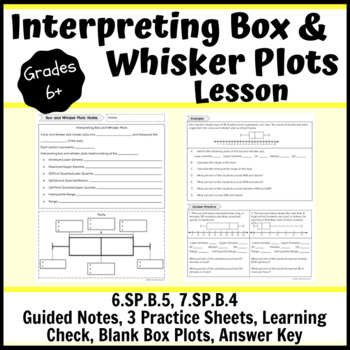
Interpreting Box and Whisker Plots Lesson- Notes, Practice, Learning Check
This interpreting box and whisker plots lesson consists of a guided notes sheet, 3 practice sheets, a learning check, 2 different half sheets of blank box plots and an answer key. You can hole punch the note pages and have students place them in their binders or a 3-prong folder. There are teacher notes to guide you through the direct instruction with students. There are three pages of practice. One page can be used as independent practice when students are ready; this could be in class or homew
Subjects:
Grades:
6th - 10th
Types:
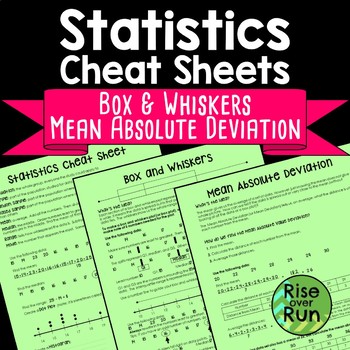
Box and Whiskers and Mean Absolute Deviation Cheat Sheets
Help students understand statistics vocabulary, dot plots, histograms, and box and whiskers diagrams, and mean absolute deviation with this resource.The three-page handout comes in two formats:Reference “Cheat Sheet” with all information filled in (pages 2-4)Guided Notes format with fill-in blanks and practice problems (pages 5-7)The first sheet defines important terms and helps students understand dot plots (or line plots) and histograms. The second sheet guides students in creating a box and w
Subjects:
Grades:
6th - 9th
Types:
CCSS:
Also included in: 7th Grade Math Activities, Lessons, Projects & More Bundle
Algebra 1 Review Cheat Sheet for SOL!
REVIEW SHEETS THAT INCLUDE THE FOLLOWING TOPICS:Coordinate PlaneDirect and Inverse VariationDomain and RangeEquations of a LineExponent LawsFactoringFunctionsGraphing InequalitiesLine and Curve of Best FitMultiplying PolynomialsPropertiesQuadraticsScatter plotsSlope and GraphingSquare and Cube RootsSystems of EquationsI give this sheet to my students as we prepare for the SOL tests so that if they get stuck, they can refer to the sheet to help jog their memory.Calculator instructions for various
Subjects:
Grades:
7th - 11th
Types:

Lent Stations of the Cross Presentation: Prewriting, Project Outline, and Rubric
This product contains everything you need to help students create a Stations of the Cross Presentation. The students will be expected to create a 14 slide PowerPoint Presentation reflecting on the 14 Stations.Includes a Word Document & PDF of the following:~Stations of the Cross Presentation Expectations: This document can be handed out to students when the project is assigned. It covers the expectations for the project, as well as a small rubric so they can see how the project will be grade
Subjects:
Grades:
7th - 12th
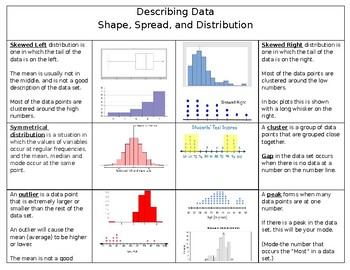
Describing Data based on shape, spread, and distribution
This is a quick foldable already put together for students to use as a reference when describing data based on its shape, spread, and distribution. It goes along with the 6th grade statistics standards.
When printing you should select two sided and print on short edge.
I got the idea from Bailey's corner, but I wanted to make a few changes. Here is the link to her store if you would like to check hers out.
https://www.teacherspayteachers.com/Product/Dot-Plots-and-Describing-the-Shape-of-Data-
Subjects:
Grades:
5th - 9th
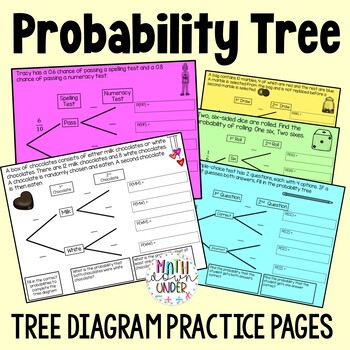
Probability Tree Diagrams Practice Pages - Independent and Dependent Events
Your students will love practicing drawing tree diagrams to solve compound probability events with these 10 printable practice pages. Independent and Dependent events are included.Starting with structured scaffolding, students are introduced to the process of creating probability trees by filling in the blanks. This approach builds confidence and ensures students grasp the fundamentals before advancing. Gradually, the scaffolding is removed, presenting blank templates that encourage students to
Subjects:
Grades:
6th - 10th
Types:
Also included in: Compound Probability Activity & Practice Bundle
Chi Squared
Chi SquaredTeaching Chi Squared to a Stats class or AP Bio and not sure where to start?! Well, you found it. I created this product for my husband, who teaching AP Biology. This pack includes a PPT introduction, complete with student fill-in-the-blank notes, that walk students through the steps of Chi Squared and gives them a general overview of how and why we use this test. Degrees of Freedom are explained, as well as p-value. Notes provide an additional practice problem to do as a class. This
Subjects:
Grades:
9th - 12th
Lent & Holy Week Unit with PowerPoint, Guided Notes, and Test. Print and Teach!
This is EVERYTHING you need to teach about Lent and Holy Week!This all-inclusive unit contains everything you will need to teach the basics about Lent and Holy Week. It includes the Catholic guidelines for fasting and abstinence as well as information on the traditional services for Ash Wednesday, Holy Thursday, Good Friday, Holy Saturday, and Easter Sunday. The students will read their way through the scriptures and summarize each portion of the Passion and Resurrection of Christ.This lesson pl
Subjects:
Grades:
7th - 10th
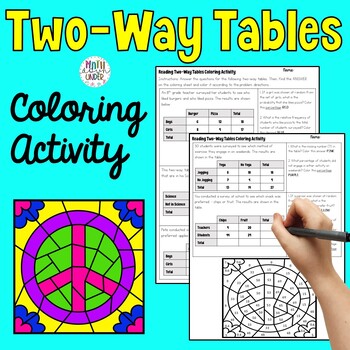
Two-Way Tables and Relative Frequency Coloring Activity
Your students will love practicing reading and interpreting two-way frequency tables in this fun, color by number activity! 13 problems to solve and a peace sign mosaic to color according to the question instructions. Perfect for your Data & Statistic Unit! The entire product is viewable in the preview file. Please follow my store and thank you for your support!Great for:ReviewMath CentersChoice BoardsHomeworkEarly finishers
Subjects:
Grades:
8th - 9th
Types:
CCSS:
Also included in: Two-Way Tables - Math Activity Bundle
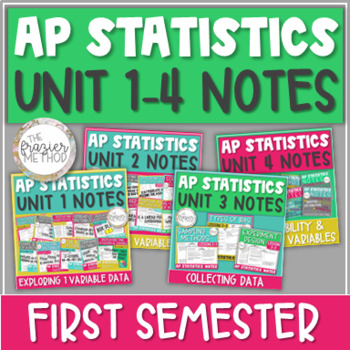
AP Statistics Notes Unit 1-4 Graphs, Linear Regression, Experiments, Probability
64 PAGES of AP® Statistics Notes! UNITS 1, 2, 3, & 4 - the entire FIRST SEMESTER of AP® Stats! Unit 1 includes histogram, box plot, median, mean, standard deviation, interquartile range, Normal Distribution, z-score... Unit 2 covers two way table, scatterplot, linear model, residual plot, correlation coefficient, linear regression computer output... Unit 3 has sampling methods, bias, experiment design... Unit 4 covers basic probability rules, compound probability of multiple events, conditio
Subjects:
Grades:
10th - 12th

Two-Way Tables and Relative Frequency Doodle Notes
Doodle notes are a tool to help students process information. I’ve found students are more engaged when using doodle notes than traditional notes, and they’re more likely to keep the notes and use them as references.
What’s Included:
The first version of the notes has pre-filled data from a hypothetical class. All of the calculations included on the answer key use this data.
The second version of the notes has a blank table so you can collect data from your class with your students. My s
Subjects:
Grades:
8th - 9th
Types:
CCSS:
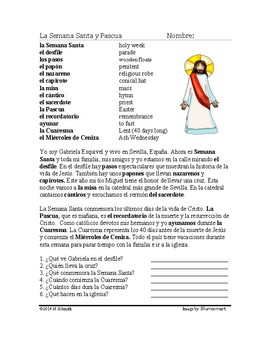
Semana Santa y Pascua Lectura - Holy Week and Easter Spanish Reading
This reading has two paragraphs. The first one is written from the first-person perspective of a teenage girl living in Sevilla, Spain during Holy Week and discusses how she and her family are celebrating. The second paragraph discusses the various holidays around this period including Ash Wednesday, Lent, Easter Sunday etc.The reading includes a glossary of specialized Easter vocabulary and 6 reading comprehension questions in Spanish. Level: Spanish 1/2 (Present tense with harder vocabulary)V
Subjects:
Grades:
8th - 12th, Higher Education, Adult Education

Moneyball Movie Guide & ANSWERS | Moneyball Worksheet | Questions (2011)
Moneyball movie questions (released 2011) help keep students engaged throughout the film by providing 26 questions for them to answer to keep them on track. Moneyball worksheet comes with a key that has suggested answers provided at the end.Moneyball Movie Guide follows Billy Beane, general manager of the Oakland A's as he an epiphany about baseball's conventional wisdom is all wrong. Faced with a tight budget, Beane must reinvent his team by outsmarting the richer ball clubs. Joining forces wi
Subjects:
Grades:
5th - 12th
Types:
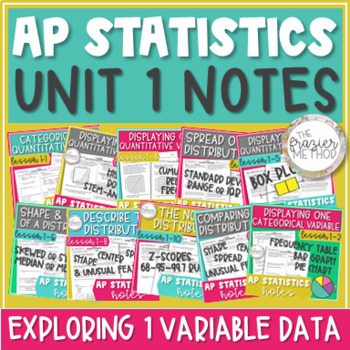
AP Statistics Notes Unit 1 Histogram, Box Plot, Skew, Mean, Normal Distribution
Use these AP® Statistics notes to teach UNIT 1 – EXPLORING ONE-VARIABLE DATA. Histograms, box plots, dot plots, stem-and-leaf plots, bar graphs, outliers, 5-number summary, z-scores, Normal Distribution / Normal Model, and describing a distribution's shape, center, & spread! Skewed or symmetric, median or mean, standard deviation or interquartile range... You can also use these notes for AP® Stats exam review! Aligns with the updated 2019-2020 objectives and standards of Unit 1: Exploring On
Subjects:
Grades:
10th - 12th
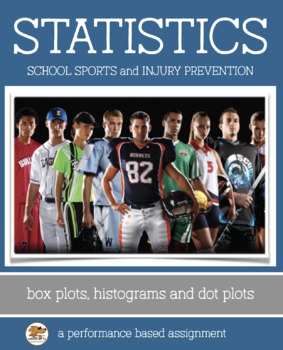
STATISTICS - Histograms, Box Plots, Dot Plots: A Performance-Based Task
Using Statistics in a Real World Scenario
Sports Injury and School Athletes
This packet includes two activities. The first activity guides students through 3 data analyses projects including identifying the best data display (box plot, histogram, dot plot) for the situation. The second activity is a performance task which asks students to critique the reasoning of others and refute a claim. In the process, students will learn that correlation does not imply causation. This can be independently
Subjects:
Grades:
8th - 11th
Types:
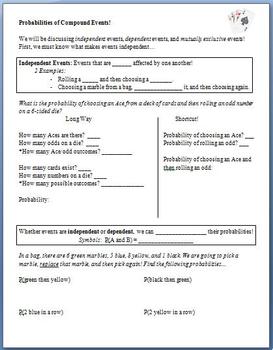
Probability of Compound Events (Guided Notes)
This lesson is meant to be used as guided notes for a whole class.
Students begin by learning what makes 2 events independent. After slowly working through a problem about rolling a die and choosing a card, they discover that they can multiply probabilities when working with these compound events. They then attempt problems involving picking marbles from a bag. Next, they learn about dependent events, and finally, mutually exclusive events.
The last 2 pages are a copy of the key.
Subjects:
Grades:
6th - 12th
Types:
Showing 1-24 of 1,483 results


