28 results
Higher education Common Core HSS-ID.C.9 resources
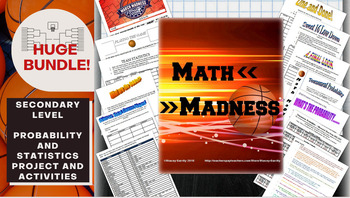
Math March Madness Full Tournament Project {BUNDLE}
Harness the excitement of NCAA March Madness with this huge project for secondary math teachers that follows all stages of the tournament! This Common Core aligned bundle comes with bonus parts not sold individually in my store so you can create a rich immersion in the tournament, practice probability and statistics and learn some interesting new ones along the way! Save $3 plus get bonus content by bundling!You can pick and choose which parts you would like to incorporate, or follow my schedu
Subjects:
Grades:
6th - 12th, Higher Education
Types:
![Preview of Statistics Final Exam and Review [AP, College, and Honors]](https://ecdn.teacherspayteachers.com/thumbitem/Statisticis-FinalReviewStudy-Guide-Exam-1711356723/original-699492-1.jpg)
Statistics Final Exam and Review [AP, College, and Honors]
You can use this Statistics Final Exam in an AP Statistics, Honors Statistics, or a College Statistics course as an assessment, review or both. What's Included?Included are 6 different versions, each including 60 well chosen representative questions in both multiple choice format and also in free response format*. These reviews and tests work well in class or as a take- home. The tests are editable with Adobe Acrobat Pro. Each test should take about 2 - 3 hours and can be taken with a graphin
Subjects:
Grades:
10th - 12th, Higher Education
Types:
CCSS:
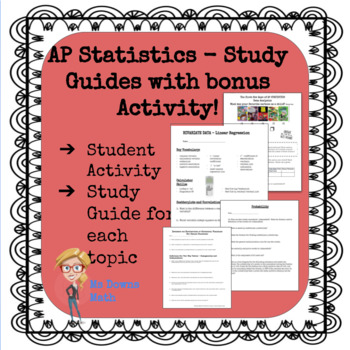
AP Statistics Study Guides - All Topics!
There is a pdf file study guide for each topic in the AP Statistics curriculum. Exploring Data, Normal Distributions, Linear Regressions, Experiments and Designing Studies, Probability, Random Variables, Sampling Distributions, Confidence Intervals, Hypothesis Tests, Comparing Populations, Chi Square Procedures, and Inference about Regression. I have students complete one for each unit. At the end of the year, they have a great study packet for the AP Exam! Student feedback has indicated that th
Subjects:
Grades:
9th - 12th, Higher Education, Adult Education
Types:
CCSS:
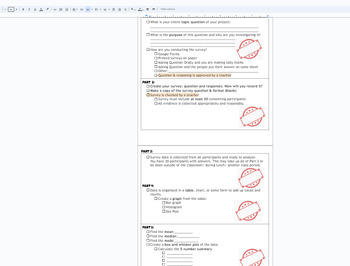
Statistics Survey project Discovery (broken down into sections) with Rubric
This is a broken down (scaffolded) packet of instructions/ guide for a Stats Project for Math 1 HS or 8th grade students. The goal of the project is for students to take a statistical survey on quantitative data (numbers) of their choice. Using this data from the survey, the following will be included in the project:Survey- the question being askedSurvey responses (requirement of 30)Data organization: Bar chart, Histogram, Dot PlotMeanMedianModeBox and Whisket Plot5 number summary (Q1,Q2,Q3, min
Subjects:
Grades:
7th - 12th, Higher Education, Adult Education
CCSS:
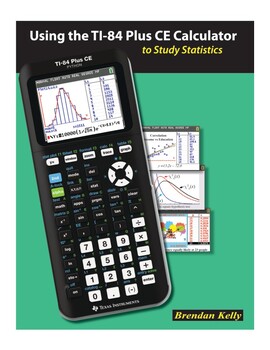
Using the TI-84 Plus CE Graphing Calculator to Study Statistics
Using the TI-84 Plus CE Calculator to Study StatisticsISBN 978-1-895997-59-0(102 pages; 8.5” x 11” trim size)The information age has made statistics one of the most important branches of mathematics. The ubiquity of real-world data enables us to explore statistical concepts using real data from interesting and current sources. As they work through the exercises in this book, students enter real data onto spreadsheets or into statistical plots on the TI-84 Plus CE Calculator while you guide their
Subjects:
Grades:
10th - 12th, Higher Education
Types:
CCSS:
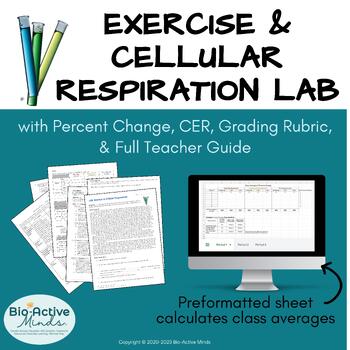
Exercise & Cellular Respiration LAB for Biology with CER, Rubric & Teacher Guide
In this interactive lab, students investigate the effect of exercise on the rate of cellular respiration by measuring heart rate, breathing rate, and carbon dioxide production (by exhaling into a BTB solution) at rest and after two exercise intervals.Students assign pre-defined lab roles and work collaboratively in groups of 3 (or 4) to carry out the procedure and collect data. Lab groups report data to the teacher for class averages (which can be displayed to guide the post lab discussion). Gro
Subjects:
Grades:
8th - 12th, Higher Education
Types:
CCSS:
NGSS:
HS-LS2-3
, HS-LS1-2
, HS-LS1-3
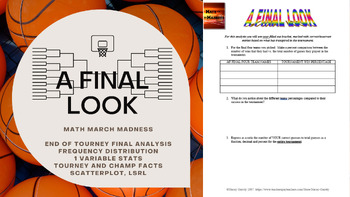
Math March Madness - A Final Look (Freq Distributions, Stats, Regression Lines)
Fill out a bracket, watch the tournament unfold and then mathematically analyze how you did! This activity is flexible enough to be used for a variety of levels. I have used all 6 pages for an AP Statistics class, and have used pages 1 through 5 for an Algebra or Algebra 2 class. You could even use it in lower levels as long as you are covering percents, and basic stats like mean, median, mode and graphing. The document is editable so you can adjust/delete to tailor to the level of statistic
Subjects:
Grades:
4th - 12th, Higher Education
Types:
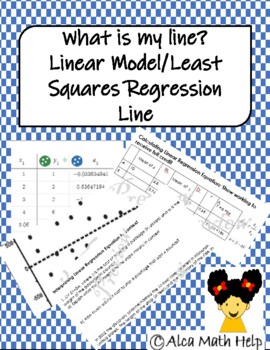
Least Squares Regression Line: What is my line?
At the end of this activity Students will be able to:Examine the residual values and determine the prediction the model made. Examine residual plots to determine the appropriateness in models.Calculate and interpret slope and y-intercept in contextEstimate the strength and relationship between variables using a scatterplot.Explain the difference between correlation and causationAnswer Key not included!This activity sheet can be used as a Unit Quiz, Classwork or HomeworkIt comprises of short answ
Subjects:
Grades:
9th - 12th, Higher Education, Adult Education, Staff
Types:
CCSS:
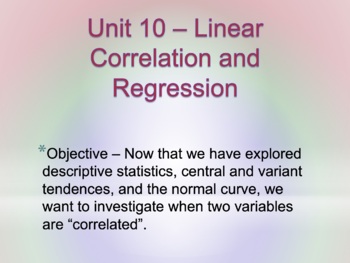
Unit 10 - Correlation & Regression (14 Days)
This is a unit plan bundle for a Statistics class. The plans include common core math standards, time frame, activities, enduring understandings, essential questions, and resources used. It is designed to last 14 days, depending on pacing. The plans include: 29-slide presentation, with annotated guide for reference2 Worksheets1 "Read & Respond" Article Worksheet2 Quizzes"Do Now" Entrance problemsReview slides (for communicator boards)Unit ReviewUnit TestUnit Project - Correlation & Regre
Subjects:
Grades:
10th - 12th, Higher Education
CCSS:
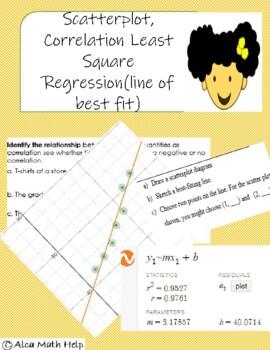
Scatterplot, Correlation and Least Square Regression (line of best fit)
At the end of this activity Students will be able to:1.Calculate the slope of a using points from the line of best fit.2.Estimate the strength and relationship between variables using a scatterplot.3.Explain correlation given the correlation coefficient4.Know facts about correlation●Answer Key included!●This activity sheet can be used as a Unit Quiz, Classwork or HomeworkIt comprises of short answer and true or false optionsPlease follow me by clicking this link
Subjects:
Grades:
11th - 12th, Higher Education, Staff
CCSS:
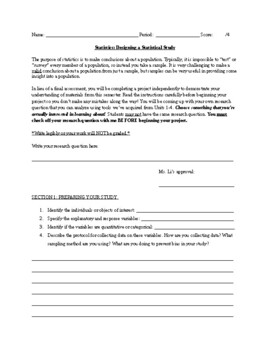
Statistics Project: Regressions + Designing a Statistical Study for High School
Hello!I've designed a statistics project that students in my class loved! This project requires students to go collect data on a topic that interests them. They have to design a sampling method that is as unbiased as possible. Students are then required to analyze their data and summary statistics. They also need to do a regression analysis on their study and make inferences using their results. This is perfect for a replacement of a test or as an end-of-semester project for students. Perfect fo
Subjects:
Grades:
9th - 12th, Higher Education
Types:
CCSS:
Also included in: AP Statistics / High School Statistics Projects
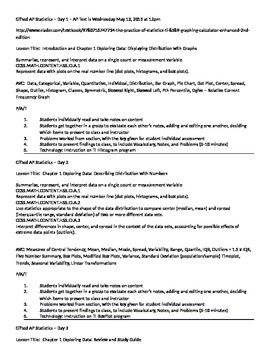
AP Statistics Lesson Plans for 29 Days with CCSS Included
Lesson Plans for High School teachers of AP Statistics. Includes the first half of the course. Common Core State Standards are included for every lesson. Easy to copy and paste into school district lesson plan site. Includes technology, group work, peer evaluation, independent study, and a common sense approach to the day by day student lead teaching of the AP Statistics course. Great template for COMPASS.
Subjects:
Grades:
12th, Higher Education
Types:
CCSS:
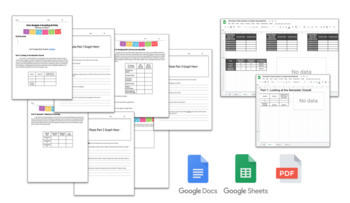
Data Analysis & Graphing Activity- End of Semester/Quarter- EDITABLE
This activity is THE perfect activity to complete at the start of a new semester or quarter! In this activity, students will be practicing their skills of analyzing data and creating graphs using their own data! Not only will students be using their own data (grades) they will, also, be reflecting on their learning and making new goals for the learning looking forward. This activity features 3 parts that look at their overall grade, their mastery of your selected learning topics/standards, and f
Subjects:
Grades:
8th - 12th, Higher Education
Types:
CCSS:
NGSS:
MS-ETS1-4
, MS-ETS1-3
, HS-ETS1-4
Algebra 1 - Common Core Practice Final Exam - Google Form #1 (45 Questions)
Hello! The purchase of this product grants the purchase of one (1) DIGITAL (Google Forms) self-grading assessments, which is a practice final exam that has a mix of forty-five (45) multiple-choice & fill-in-the-blank questions on Algebra 1 - 1st Semester Common Core Curriculum.Goals Of This Assessment: Students will be able to:Simplify or identify equivalent algebraic expressions. Represent math relationships using symbolic algebra. Differentiate between linear and nonlinear functions. Model
Subjects:
Grades:
6th - 12th, Higher Education, Adult Education
Types:
CCSS:
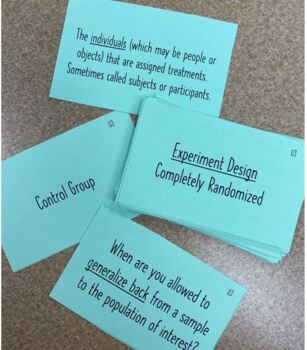
AP Statistics Unit 3 Flashcards - Collecting Data - READY TO PRINT!
AP Statistics Unit 3 Flash Cards - Collecting Data (Experiment Design, Sampling Techniques, Bias)Help your students practice vocabulary terms and big ideas from Unit 3: Collecting Data for the AP Statistics Exam! These flash cards are ready to print double-sided on cardstock or paper. Concepts and terms are aligned with the current College Board Course and Exam Description for AP Statistics.
Subjects:
Grades:
9th - 12th, Higher Education
CCSS:
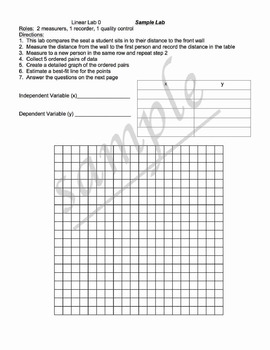
Linear Relationship Labs
This project has 1 sample lab to complete together as a class and 6 other labs that create a linear relationship.
Students work through the labs collecting data and then analyze the data to create equations, use calculators or spreadsheets to create regression equations (best fit lines), and use the equations to make predictions.
classes: algebra 1, geometry, algebra 2, applied math
Here are links to my other algebra projects:
Click Here to see my project: Systems of Equations - Comparing Ph
Subjects:
Grades:
7th - 12th, Higher Education, Adult Education
Types:
CCSS:
Correlation and Causation (Lesson with Homework)
Elementary Statistics - Correlation and CausationCommon Core Aligned Lesson with HomeworkThis lesson plan includes:-Lecture Notes (PDF, PowerPoint, and SMART Notebook)-Blank Lecture Notes (PDF and SMART Notebook)-Homework (PDF and Word)-Answer Key (PDF)You do not need to have PowerPoint or SMART Notebook to receive the full benefits of this product. There are also PDF versions included!Lesson Objectives:-Distinguish between correlation and causation.Common Core Standards:S.ID.9 - Distinguish bet
Subjects:
Grades:
10th - 12th, Higher Education
CCSS:
Also included in: Correlation and Regression Lesson Plan Bundle
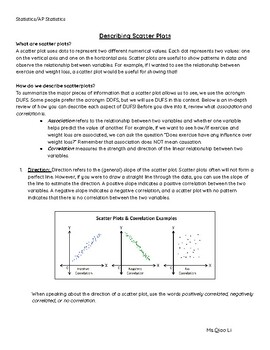
Describing Scatter Plots Graphic Organizer and Info Sheet: AP Statistics
If your students are struggling with describing the different aspects of scatter plots (direction, form, strength, etc.) this graphic organizer is a good resource to help your students write their responses. This can be used in an AP Statistics class or an elementary statistics course. It includes detailed information about each part of describing a scatter plot, a graphic organizer to help students write their own responses, and an example.
Subjects:
Grades:
9th - 12th, Higher Education
CCSS:
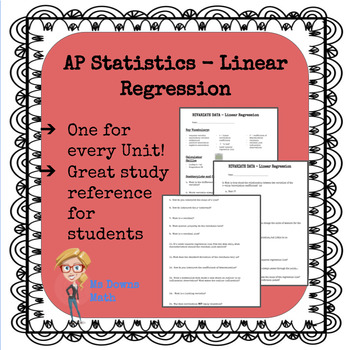
AP Statistics Linear Regression Study Guide
At the beginning of each unit, I give my students a study guide that is due the day of the unit test. These guides are a good way to prepare for the unit as we go. At the end of the year students have a nice reference book for the whole course!
Subjects:
Grades:
9th - 12th, Higher Education, Adult Education
Types:
CCSS:
Also included in: AP Statistics Study Guides - All Topics!
Passion-Driven Statistics E-book (Introductory/AP Statistics Course Textbook)
Passion-Driven Statistics is an NSF-funded, multidisciplinary, project-based curriculum that supports students in conducting data-driven research, asking original questions, and communicating methods and results using the language of statistics. The curriculum supports students to work with existing data covering psychology, health, earth science, government, business, education, biology, ecology and more. From existing data, students are able to pose questions of personal interest and then use
Subjects:
Grades:
6th - 12th, Higher Education, Adult Education
Types:

Dr. Wimpey's Quick Reference for Statistics
I created this all-in-one document/foldable to help my statistics classes. It contains definitions, procedures, etc. It is useful for AP, honors, and CP levels in high school as well as college introductory statistics courses.
Subjects:
Grades:
11th - 12th, Higher Education
CCSS:
Learn-a-long: 'Nice Genes!' Episode 5
The download is a PDF for students to help follow along with Episode 5 of the Nice Genes! Podcast found HEREJust like any good superhero comic, we start this episode with the science going incredibly wrong. Think: vats of toxic waste producing evil mutants that ravage the city. Or maybe not so evil. It really depends on your perspective. Just like the X-men, genetic mutations get a bad rap in the public eye. But they aren’t all nasty.Dr. Kaylee Byers speaks with data scientist and evolutionary b
Subjects:
Grades:
8th - 12th, Higher Education, Adult Education
Types:
CCSS:
SPSS software Secondary Data Analysis Workshop (Introductory/AP Statistics)
This handout is intended for those interested in teaching/learning basic introductory statistics concepts to analyze real data. Students will learn how to tell a story using secondary data analysis. The handout is for SPSS and the US Longitudinal Study of Adolescent Health data set. For handouts on the data set code book and raw data file, a PowerPoint to accompany the handout, or questions please email kristin.flaming@gmail.com or ldierker@wesleyan.edu.This handout was developed as a condensed
Subjects:
Grades:
6th - 12th, Higher Education, Adult Education
Types:
Translation Code
As part of our NSF-funded passion-driven statistics project, we have just started to share more widely our “translation code” aimed at supporting folks in learning code-based software and in moving more easily between them. The pdf includes all of the basic syntax for managing, displaying and analyzing data, translated across SAS, R, Python, Stata and SPSS. http://bit.ly/PDSTranslationCode.For more information about our warm and welcoming data-driven curriculum, check out https://passiondrivenst
Grades:
6th - 12th, Higher Education, Adult Education
Types:
Showing 1-24 of 28 results

