5 results
5th grade Common Core HSS-ID.C.9 resources
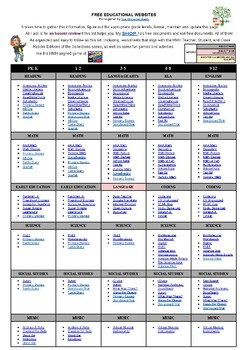
FREE EDUCATIONAL WEBSITES LIST 4 ALL GRADES K-12 AND SUBJECTS + TEACHER RESOURCE
Sometimes, you just need a list of websites for everyone. Here it is. FREE EDUCATIONAL WEBSITES Put together by Teach Me, Maria!It takes time to gather this information, figure out the appropriate grade levels, and format, maintain, and update this page. All I ask is for an honest review if this list helps you.
Subjects:
Grades:
PreK - 12th, Staff
Types:
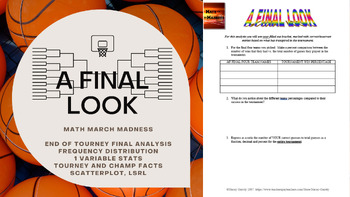
Math March Madness - A Final Look (Freq Distributions, Stats, Regression Lines)
Fill out a bracket, watch the tournament unfold and then mathematically analyze how you did! This activity is flexible enough to be used for a variety of levels. I have used all 6 pages for an AP Statistics class, and have used pages 1 through 5 for an Algebra or Algebra 2 class. You could even use it in lower levels as long as you are covering percents, and basic stats like mean, median, mode and graphing. The document is editable so you can adjust/delete to tailor to the level of statistic
Subjects:
Grades:
4th - 12th, Higher Education
Types:

Tongue Twisters
Looking for a fun way for students to gather data? Then, try this tongue twister activity! Students work in a group and time each other saying different length tongue twisters 10 times each. Once they have the data collected, they can use Google Sheets (step-by-step directions provided) to make a scatterplot and insert a trend line. They can then use the line or equation to make a prediction about how long it should take them to say a longer tongue twister 10 times. Finally, they will test
Subjects:
Grades:
5th - 12th
Types:
CCSS:

All of the Common Core Math Standards Checklists
This is a bundle of checklists for Math Common Core Standards for all of the grades (K-12) on an excel spreadsheet with 5 columns for data input. These standards are organized in their own sub-domains to coordinate lessons. Please see my free file for an example.
Subjects:
Grades:
K - 12th
Types:
Dress Code Data Analysis and Visualization
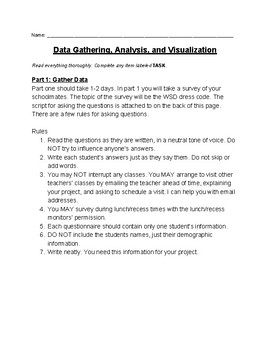
If your school has a dress code, use this Project Based Learning packet to teach your students about gathering, analyzing, and visualizing authentic data. The packet covers calculating percentages, measures of central tendency (mean, median, mode) and range, analyzing multiple data sets in conjunction to determine correlations, and visualizing data for improved analysis and communication. The packet is written to be mostly self guided. It is great as an enrichment project or as a whole class pro
Subjects:
Grades:
5th - 9th
Types:
CCSS:
Showing 1-5 of 5 results

