31 results
6th grade Common Core HSS-ID.C.9 resources
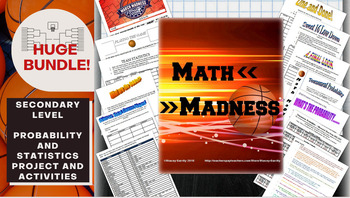
Math March Madness Full Tournament Project {BUNDLE}
Harness the excitement of NCAA March Madness with this huge project for secondary math teachers that follows all stages of the tournament! This Common Core aligned bundle comes with bonus parts not sold individually in my store so you can create a rich immersion in the tournament, practice probability and statistics and learn some interesting new ones along the way! Save $3 plus get bonus content by bundling!You can pick and choose which parts you would like to incorporate, or follow my schedu
Subjects:
Grades:
6th - 12th, Higher Education
Types:
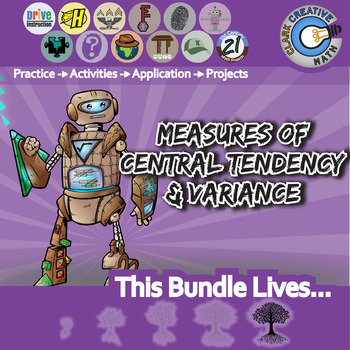
Measures of Center & Variance Unit Bundle - Distance Learning Compatible
This is a selection of my Measures of Center & Variance resources all in a money saving Essential Bundle! You save significant money and time versus purchasing these separately!Essential Bundles are designed to give you everything you need to rock your unit. Warmups, Notes, Activities, Games, Exit Tickets, and Tests. You will find a selection of my Drive Instruction, Escapes, Boot Camp, Adventures, Whodunnits, CSI, Person Puzzles, STEM-ersions, Herowork, TableTop and my 21st Century Math Pro
Subjects:
Grades:
6th - 12th
Types:
Unit 1-Statistics (Math 1)
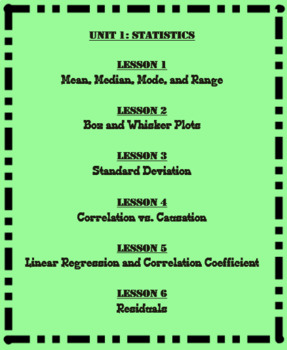
This is the first Unit of the eight Units that I cover in Math 1. This unit is broken up in to six different lessons that are listed below. Each lesson includes a SMART Notebook presentation, a student note-taking guide, and an answer key. Also included in this unit are student flashcards, a test outline, and a 25 question multiple choice test.
Unit 1: Statistics
Lesson 1: Mean Median Mode Range Outliers and Skew
Lesson 2: Box and Whisker Plots
Lesson 3: Standard Deviation
Lesson 4: Correlati
Subjects:
Grades:
6th - 12th
CCSS:
FREE EDUCATIONAL WEBSITES LIST 4 ALL GRADES K-12 AND SUBJECTS + TEACHER RESOURCE
Sometimes, you just need a list of websites for everyone. Here it is. FREE EDUCATIONAL WEBSITES Put together by Teach Me, Maria!It takes time to gather this information, figure out the appropriate grade levels, and format, maintain, and update this page. All I ask is for an honest review if this list helps you.
Subjects:
Grades:
PreK - 12th, Staff
Types:
Math March Madness - A Final Look (Freq Distributions, Stats, Regression Lines)
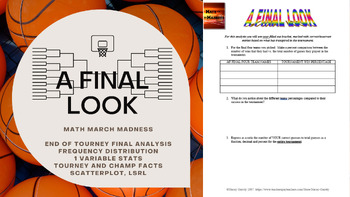
Fill out a bracket, watch the tournament unfold and then mathematically analyze how you did! This activity is flexible enough to be used for a variety of levels. I have used all 6 pages for an AP Statistics class, and have used pages 1 through 5 for an Algebra or Algebra 2 class. You could even use it in lower levels as long as you are covering percents, and basic stats like mean, median, mode and graphing. The document is editable so you can adjust/delete to tailor to the level of statistic
Subjects:
Grades:
4th - 12th, Higher Education
Types:
Silence the Violence -- International Data Analysis - 21st Century Math Project
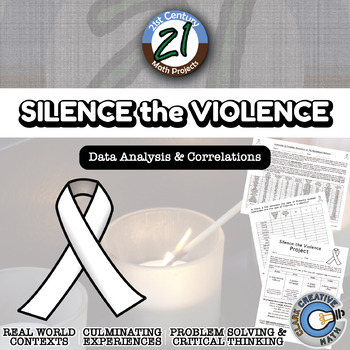
Silence the Violence intends to take a closer look at gun violence throughout the world. Is there a correlation between gun ownership and gun violence? While this is on the news, and people argue back and forth, unfortunately there are not a lot of statistics cited.I built this project through the use of correlations of authentic international data. I have included content for either middle school (plotting and calculating) or high school (calculating correlation with summations). The results ar
Subjects:
Grades:
6th - 12th
Types:
CCSS:
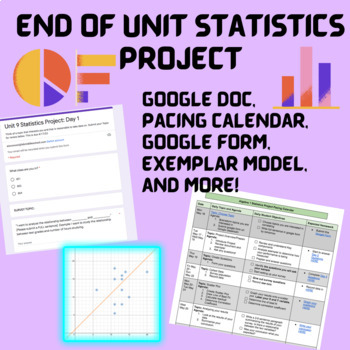
End of Unit Statistics Project- Collecting and Analyzing Data!
This is an amazing hands off project for your students to work on during their statistics unit. I often replace our end of unit test with this project, and make it a take-home assessment so they are doing most of the work for homework, but you could easily build it into your class periods! Students will be required to: come up with a survey topic determine population, sample, and questionsgather the data and turn it into a scatterplotdetermining the line of best fitresidualscorrelation coefficie
Subjects:
Grades:
6th - 12th
Types:
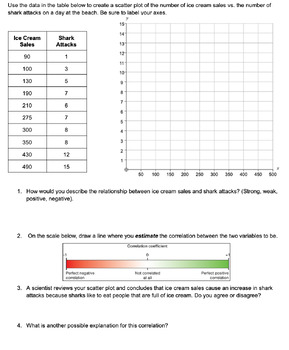
Correlation vs Causation Exploration
This product allows students to create and analyze scatter plots and then determine if the relationships shown are causal or correlated. Topics include shark attacks vs ice cream sales, hot cocoa consumption vs car accidents, and iPhone sales vs deaths by falling down stairs (plus more). Students will be asked to consider whether the data shown proves that the two variables are causal or whether there is another explanation for their correlation. Students always have a fun time considering why t
Subjects:
Grades:
6th - 12th
Types:
CCSS:
Correlation vs Causation (Math 1)
This lesson is the fourth of six lessons in the Math 1 Statistics Unit.
This lesson includes important vocabulary, examples (guided practice), and class work (independent practice). At the end of the presentation is a Ticket Out the Door for the students.
There is a note-taking guide for the students to fill out as the teacher goes through a SMART Notebook presentation.
Unit 1: Statistics
Lesson 1: Mean Median Mode Range Outliers and Skew
Lesson 2: Box and Whisker Plots
Lesson 3: Standard
Subjects:
Grades:
6th - 12th
CCSS:
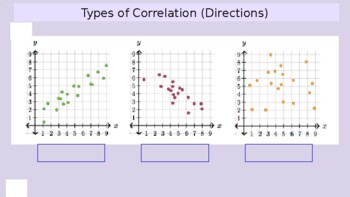
Correlation Coefficient Notes - Scale of r with accompanying scatter plot graphs
Clear notes about the correlation coefficient shown on a scale so students can see both strength, the scatter plot, and the direction all in one.
Subjects:
Grades:
6th - 9th
CCSS:
Tongue Twisters
Looking for a fun way for students to gather data? Then, try this tongue twister activity! Students work in a group and time each other saying different length tongue twisters 10 times each. Once they have the data collected, they can use Google Sheets (step-by-step directions provided) to make a scatterplot and insert a trend line. They can then use the line or equation to make a prediction about how long it should take them to say a longer tongue twister 10 times. Finally, they will test
Subjects:
Grades:
5th - 12th
Types:
CCSS:

Name Value Activity
Looking for an easy way to introduce bivariate data, scatterplots and trend lines (line of best fit) to your students? Try this name value activity! Students calculate their name's value and create either one big class scatterplot or individual scatterplots with everyone's data to see if the number of letters in a name impacts name value. To make a class scatterplot, simply draw the graph on large chart paper and have students place a round sticker on their ordered pair, or share a Google She
Subjects:
Grades:
6th - 12th
CCSS:
Measures of Center - EDITABLE Slides, Notes, INB & Test+++ Drive Math
Drive Instruction with instructional resources that live in the cloud on Google Drive! All of the docs are COMPLETELY EDITABLE and can be differentiated to meet your needs or the needs of your students. PDFs are also included in the download if you prefer them that way. Each Drive Instruction set includes warm-ups, exit tickets, notes, presentations, digital interactive notebooks and tests. These are designed to be complementary to all of my innovative supplemental resources and an improvement o
Subjects:
Grades:
6th - 10th
Also included in: Measures of Center & Variance Unit Bundle - Distance Learning Compatible

All of the Common Core Math Standards Checklists
This is a bundle of checklists for Math Common Core Standards for all of the grades (K-12) on an excel spreadsheet with 5 columns for data input. These standards are organized in their own sub-domains to coordinate lessons. Please see my free file for an example.
Subjects:
Grades:
K - 12th
Types:
Algebra 1 - Common Core Practice Final Exam - Google Form #1 (45 Questions)
Hello! The purchase of this product grants the purchase of one (1) DIGITAL (Google Forms) self-grading assessments, which is a practice final exam that has a mix of forty-five (45) multiple-choice & fill-in-the-blank questions on Algebra 1 - 1st Semester Common Core Curriculum.Goals Of This Assessment: Students will be able to:Simplify or identify equivalent algebraic expressions. Represent math relationships using symbolic algebra. Differentiate between linear and nonlinear functions. Model
Subjects:
Grades:
6th - 12th, Higher Education, Adult Education
Types:
CCSS:

STEM-ersion - Correlations of Scatterplots Printable & Digital Activity
STEM-ersion assignments aim to immerse students in an authentic application within a STEM career. This STEM-ersion focuses on the correlation of scatterplots. Students often ask what careers will use certain math skills and I think this is an opportunity to show them where the thinking is used! These problems aim to help students construct responses with my Evidence - Analysis - Conclusion framework that I use in all of my classes. These questions are carefully crafted not to have one correct an
Subjects:
Grades:
6th - 12th
Types:
CCSS:
Also included in: Measures of Center & Variance Unit Bundle - Distance Learning Compatible
Measures of Center Game - Small Group TableTop Practice Activity
Bring the TableTop Game revolution to your classroom! Board games are experiencing a renaissance and tapping into their innate engagement is a no brainer. This is the natural evolution of task cards. TableTop Math games cover a single unit of math study. The questions range from simple skill practice to application. Provided are four different game styles that can be played with the same set of math cards. Mix it up or let your students choose what to play. The choice is yours! In Journey, stude
Subjects:
Grades:
6th - 10th
Types:
Also included in: Measures of Center & Variance Unit Bundle - Distance Learning Compatible
Scatterplots Statistics Project Group Presentation Experiment
This project requires students to determine a hypothesis, collect data, make a scatterplot, and analyze the scatterplot for an correlations. Then, students will make predictions, determine if their hypothesis was correct, and present their findings to the class. This project can be used as an independent assignment or as a group project. It can be added to Canvas as a Google Assignment. The project comes with an already made rubric.
Subjects:
Grades:
6th - 12th
CCSS:
Dress Code Data Analysis and Visualization
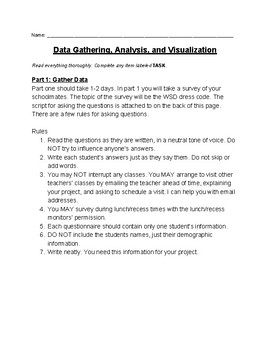
If your school has a dress code, use this Project Based Learning packet to teach your students about gathering, analyzing, and visualizing authentic data. The packet covers calculating percentages, measures of central tendency (mean, median, mode) and range, analyzing multiple data sets in conjunction to determine correlations, and visualizing data for improved analysis and communication. The packet is written to be mostly self guided. It is great as an enrichment project or as a whole class pro
Subjects:
Grades:
5th - 9th
Types:
CCSS:

STEM-ersion - Correlation Coefficient Printable & Digital Activity
STEM-ersion assignments aim to immerse students in an authentic application within a STEM career. This STEM-ersion focuses on the correlation coefficient. Students often ask what careers will use certain math skills and I think this is an opportunity to show them where the thinking is used! These problems aim to help students construct responses with my Evidence - Analysis - Conclusion framework that I use in all of my classes. These questions are carefully crafted not to have one correct answer
Subjects:
Grades:
6th - 12th
Types:
CCSS:
Also included in: STEMersion - ALGEBRA 2/PRE-CALC BUNDLE - Printable & Digital Activities
Statistics Test Outline (Math 1)
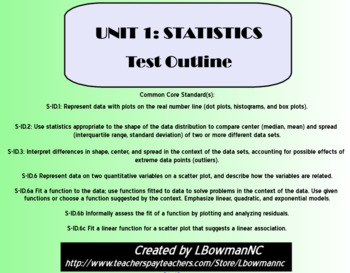
This outline briefly revisits the lessons presented to the students in the Math 1 Statistics Unit so that they have a quick reference sheet to aid them in studying!
Follow the outline up with the Flashcards that can be found in my store!
Subjects:
Grades:
6th - 12th
CCSS:
Statistics Flashcards (Math 1)
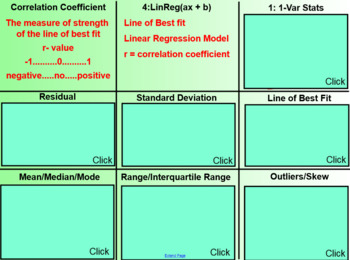
These flashcards will help the students review important vocabulary and concepts from the Math 1 Unit 1 Statistics Unit.
The flashcards can be pre-printed by the teacher and filled in by the students during a review before the test.
Unit 1: Statistics
Lesson 1: Mean Median Mode Range Outliers and Skew
Lesson 2: Box and Whisker Plots
Lesson 3: Standard Deviation
Lesson 4: Correlation vs Causation
Lesson 5: Linear Regression and the Correlation Coefficient
Lesson 6: Residuals
Subjects:
Grades:
6th - 12th
CCSS:
Statistics Test (Math 1)
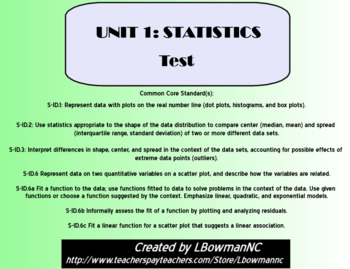
This is a 25 question multiple choice test that assesses the students on the standards covered in the Math 1 Statistics Unit. The test questions range in difficulty level.
Subjects:
Grades:
6th - 12th
Types:
CCSS:
Ask the Class - surveying, box plots, normal curve, probability, correlation
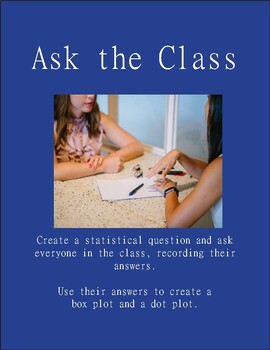
Students will create their own statistical question and ask everyone in the class. They will use their data to draw a box plot and a dot plot. This is an introduction to what qualifies as a "statistical" question. There is an extension for high school math on pages 3, 4 and 5 that goes into correlation, normal curves and probability.
Subjects:
Grades:
6th - 11th
Also included in: 6th Grade Math Bundle
Showing 1-24 of 31 results

