427 results
High school statistics resources for Microsoft PowerPoint under $5
Statistics Project - Statistics Olympics
Engage your students in their study of statistics as they compete in self-created Olympic style events. This project will engage students and help them discover meaning and apply concepts including measures of central tendency, quartiles, outliers, variance, standard deviation, z-scores, box plots, histograms, normal and skewed distributions. This project can be completed in approximately 6-8 days (50-min class periods) ** March 2023 Update **Visual updates to all slides and documentsRubric ali
Subjects:
Grades:
6th - 12th
CCSS:
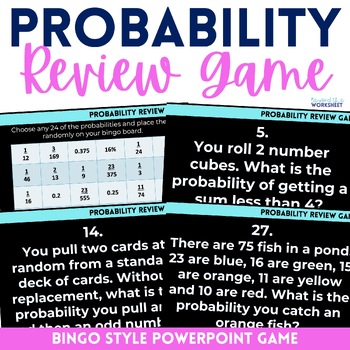
Probability PowerPoint Review Math Game
⭐️ This probability game is a fun way for students to practice or review probability skills. Included are basic and compound probability questions. ⭐️ Students must choose 24 of 30 probabilities to include on their Bingo card. The PowerPoint includes 30 questions for them to solve in order to play Bingo. ⭐️ Included in the file is the PowerPoint, Bingo Card and Answer sheet. Available in the following bundle: 7th Grade Curriculum Resources Mega BundleLicensing Terms:By purchasing this product, y
Subjects:
Grades:
7th - 9th
Also included in: 7th Grade Math Curriculum Supplemental Activities Bundle
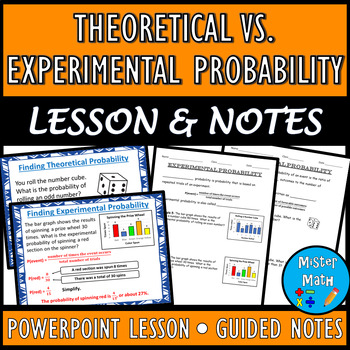
Theoretical vs. Experimental Probability PPT & Guided Notes BUNDLE
This BUNDLE includes a PowerPoint Lesson and a corresponding Guided Notes Packet to assist students in learning about theoretical and experimental probability. Students will learn the concepts of theoretical and experimental probability, as well as how to find the probabilities of each. Plenty of real-life examples are included to give students ample opportunities to practice the skills. Overall, the 21-slide PowerPoint and 6-page guided notes packet covers the following topics:Theoretical Proba
Subjects:
Grades:
6th - 9th
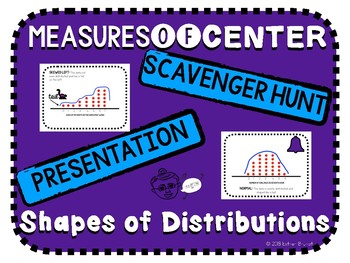
Shapes of Distributions and Measures of Center Scavenger Hunt and Presentation
A note to the teacherThis resource is for teaching shapes of distributions, analyzing the use of the mean versus the median, and deciphering which among the two is higher based on the shape of the distribution.This resource includes:Keynote and Powerpoint Presentation & PDF(Animated)Shapes of DistributionsNormalSkewed LeftSkewed Rigt2 Examples EachWhich Measure of Center is More Appropriate (Mean vs Median)6 Example Knowledge Check Which Measure of Center is Higher (Mean vs Median)?6 Example
Subjects:
Grades:
8th - 12th
Also included in: Math Activity Bundle
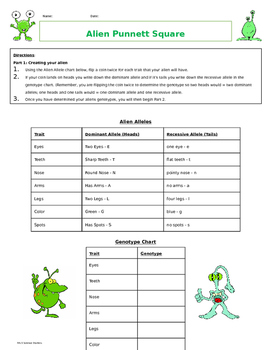
Alien Punnett Square Activity
This is a fun way to teach or reinforce Punnett squares. Students will be creating an alien based on genotypes picked by tossing a coin. Then use those genotypes to draw an alien. Once everyone has their alien, they will then "breed" their aliens to produce offspring. Students can use this activity to learn about...- Punnett squares- Probability- Genetics and HeredityIt is also a great tool for interdisciplinary lessons incorporating math (probability), science (genetics), and art (drawing).As a
Subjects:
Grades:
6th - 9th
Types:
CCSS:
Probability project using Real-World March Madness Tournament
Jump into the March Madness tournament to apply probability concepts to a real-world application. Great for your sports-loving students. Students explore probability first by determining the probability that a team will win. Students, further, weight teams based on historical data and/or team statistics. This mini-project allows for creative problem-solving and has some open-ended answers.Included in this resource:★ Student pages for 3 March Madness related activities★ Detailed guidelines fo
Subjects:
Grades:
7th - 10th
Types:
Also included in: 7th Grade Math Resource Bundle
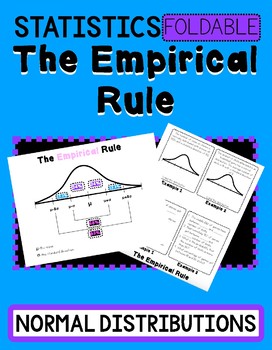
The Empirical Rule- Normal Distribution Foldable & Powerpoint
This resource is for the empirical rule. Students will label normal distributions with 2 real-world scenarios.This resource is accompanied by an animated Powerpoint and or Keynote file to present in the classroom. The presentation includes 8 additional examples. All answer keys are included.Printing:When printing the foldable set the printer to flip on the short side. You will fold the paper “hamburger” style just enough to show the title, The Empirical Rule.Sign up for my email list for freebie
Subjects:
Grades:
8th - 10th
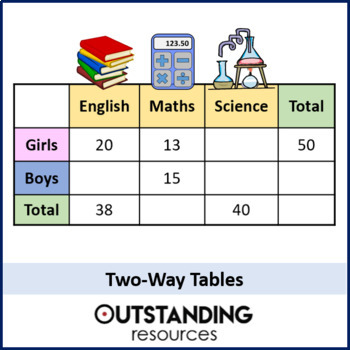
Two-Way Tables and Probability Lesson
This is a whole lesson looking at the different aspects of Two-Way Tables. This is a way of displaying data and questions are often more varied than some students may think. The lesson covers three main types of questions 1) Filling in missing data 2) Reading data from a two-way table 3) Taking figures out of a worded context and putting it into a two-way table in order to solve a probability. This lesson is ready to go, with no prep required. It is also great for home learning and flip learnin
Subjects:
Grades:
6th - 10th
Also included in: Statistics ALL LESSONS
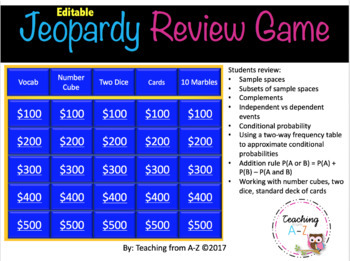
Probability Review Game
Use this Jeopardy-like review game to improve your students' understanding of key concepts in probability. This is a fun way to have students review:*Sample spaces*Subsets of sample spaces*Complements*Independent vs dependent events*Conditional probability*Using a two-way frequency table to approximate conditional probabilities*Addition rule P(A or B) = P(A) + P(B) – P(A and B)*Working with number cubes, two dice, standard deck of cardsThis is a PowerPoint Presentation. You can EDIT the problems
Subjects:
Grades:
9th - 12th
Also included in: Algebra Review Game Growing Bundle
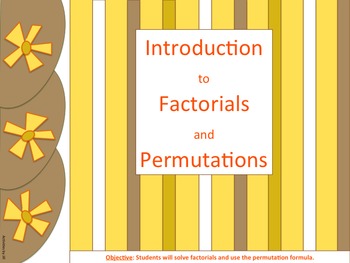
Introduction to Factorials and Permutations Presentation, Notes & Practice
Focus of Lesson: Calculate factorials and use the permutation formula.
Lesson: Use the PowerPoint presentation with layered animation accompanied by a whole class discussion.
Alternate Lesson: Does your school have one-to-one computing? Have students view the presentation on their own device. This option allows students to proceed at their own pace and ask the teacher for clarification as needed.
Presentation: Slides 1-3
Student Note-taking Outline: Slides 4-5
20 Practice Problems: Slides
Subjects:
Grades:
8th - 12th, Higher Education
Data Project Misleading Data Analysis Statistics
Statistics can be used to share information. Sometimes the data is misleading. In this AP Statistics mini project students examine how data can be used to tell a story AND how that story can be incomplete. This is part of the AP Statistics curriculum.Included in this resource:Warm-up activity for misleading dataMisleading data project guidelinesEditable RubricAnswer key for activityThis resource can be found in the following bundles:AP Statistics CurriculumAP Statistics Unit 1Get students r
Subjects:
Grades:
9th - 12th
Types:
CCSS:
Also included in: Descriptive Statistics AP Statistics
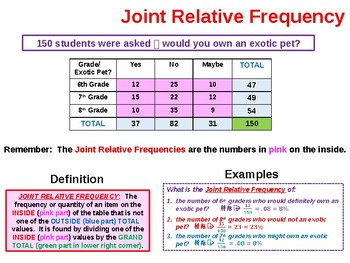
Two Way Frequency Tables Summary
This MS PowerPoint presentation provides background information on 2-Way Frequency Tables as well as the specific steps to follow create and analyze them. It is used to kickoff our study of this subject n my Pre-Algebra and Math I classes. It addresses all of the terms encountered in the construction and use of 2-Way tables including Joint Relative Frequency, Marginal Relative Frequency and Conditional Relative Frequency. It is a totally animated ppt file and very easy for students to underst
Subjects:
Grades:
8th - 10th
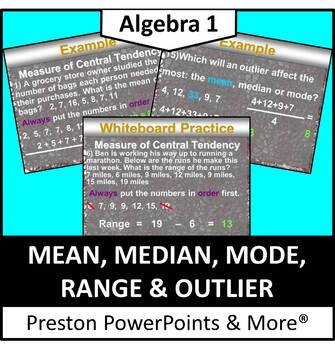
Mean, Median, Mode, Range and Outlier in a PowerPoint Presentation
Mean, Median, Mode, Range and Outlier in a PowerPoint PresentationThis slideshow lesson is very animated with a flow-through technique. It was made for my Algebra 1 class, but can be used for lower grades aw well. The lesson teaches how to solve for mean, median, mode and range. It also teaches to identify outliers in a set of data and find the measure of central tendency.NEW: The lesson is in an editable format so you can tailor the lesson to your class. The problems and clipart can’t be edit
Subjects:
Grades:
6th - 10th
Psychology Random Sample Population Stats M&M Worksheet for Research Methods
Psychology or Statistics Random Sample & Population Statistics M&Ms Worksheet Activity for Research Methods includes a teacher direction sheet with materials that you need and how to complete the activity along with printable handout for students. *Student Favored activity*Please email me with any questions at ReadySetLearnSocialScience@yahoo.comIf you would like to get updates on NEW and CURRENT resources...►FOLLOW Me on Teachers Pay Teachers►FOLLOW Me on Pinterest►FOLLOW Me on Instagr
Subjects:
Grades:
4th - 12th, Adult Education
Types:
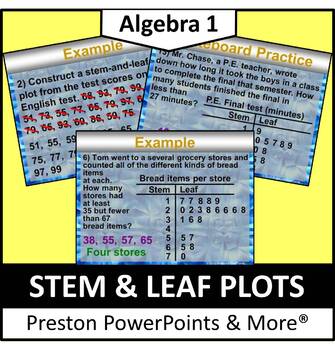
Stem and Leaf Plots in a PowerPoint Presentation
Stem and Leaf Plots in a PowerPoint PresentationThis slideshow lesson is very animated with a flow-through technique. I developed it for my Algebra 1 class, but it can be used for lower grades as well. This lesson was one of a chapter that was used as a review for all previous grades. The lesson teaches how to interpret data from the stem-and-leaf plot and make and use a stem-and-leaf plot to put data in order.NEW: The lesson is in an editable format so you can tailor the lesson to your class.
Subjects:
Grades:
6th - 9th
CCSS:
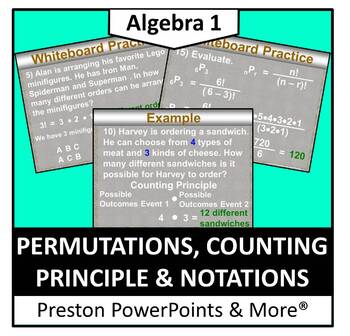
Permutations, Counting Principle and Notations in a PowerPoint
Permutations, Counting Principle and Notations in a PowerPoint PresentationThis slideshow lesson is very animated with a flow-through technique. I developed the lesson for my Algebra 1 class, but it can also be used for upper level class reviews. This lesson teaches how to find the total number of permutations, solve a combination problem, solve permutations and combination problem in notation form.NEW: The lesson is in an editable format so you can tailor the lesson to your class. The problem
Subjects:
Grades:
8th - 11th
CCSS:
STANDARD DEVIATION for DUMMIES POWERPOINT
I created this powerpoint for my AP Biology students in the hope that they will have a firmer grasp of what standard deviation is beyond just a formula that is on an excel spreadsheet. Their intrinsic understanding helped them create beautiful graphs from their lab "Factors affecting enzyme activity lab" that I have included at the end of the powerpoint. Please let me know if you found it useful or what is lacking and I can make it even better as I find students shy away from the statistics when
Subjects:
Grades:
10th - 12th, Higher Education, Adult Education, Staff
Types:
Single Variable Statistics Review Game | One-Variable Stats Game
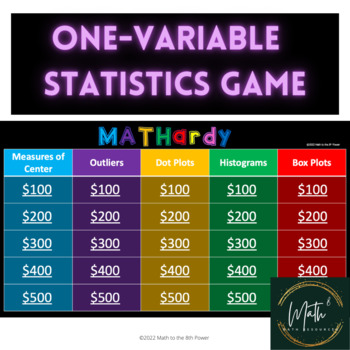
This "Jeopardy-style" game includes the following categories:Measures of CenterOutliersDot PlotsHistogramsBox PlotsThis activity is a great way to engage students in a review of Single Variable Statistics before an assessment or as a review, and can be used in the classroom or virtually! GREAT FOR AN ENGAGING TEST PREP!You can edit/modify any questions or categories for your own classroom use, but not for commercial use. This .ppt file is fully linked so that the home screen takes you to the q
Subjects:
Grades:
6th - 9th
Types:
CCSS:
Statistical Analysis PowerPoint
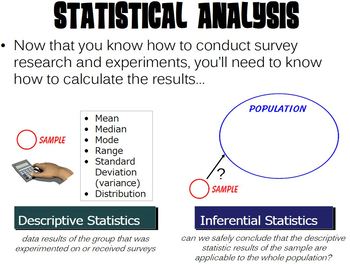
Contains a PowerPoint presentation covering statistical analysis. This PP was designed to be used with a Psychology or AP Psychology course as part of a Research Methods unit, but it could also be used in a variety of math and/or statistic classes.The PowerPoint is HIGHLY animated and is designed to capture student attention. Each slide has transitions along with rich, moving media. Additionally, a guided note sheet (both an editable Microsoft Word version and a PDF version) is included in the z
Subjects:
Grades:
7th - 12th, Higher Education, Adult Education, Staff
The Fundamental Counting Principle, Permutations, and Combinations Review Game
This resource comes with a PowerPoint Slide Show game, handouts for students, and keys and printing instructions for teachers. It covers the topics mentioned in the title above. It is designed to be interactive, i.e. you can click on questions and it will navigate your presentation to the right page. Once you view the answer, you simply click at the bottom right to go back to the questions page. It also keeps track of the questions that have already been answered as long as you do not exit the s
Subjects:
Grades:
9th - 12th
CCSS:
Two-Way Frequency Tables (Google Form!)
Two-Way Frequency Tables (Google Form!)This product includes:(1) Google Form activity. The form contains 3 different two-way frequency tables and a total of 16 questions. I personally use this activity as part of my data analysis unit. This Google Form is perfect for a blended learning teaching format. It is also a perfect resource for a flipped classroom. Enjoy!"The mission of WRESTLE WITH MATH is to create engaging, highly effective resources for the math classroom"
Subjects:
Grades:
6th - 9th
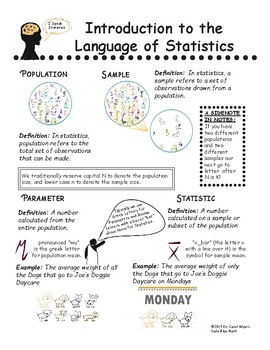
Introduction to the Language of Statistics - SketchNotes and Lecture Slides
This is a guided lecture that covers the basic vocabulary of Statistics, including Population, Statistic, Types of Data, Types of Sampling and Types of Studies. The lecture notes use simple pictures, icons and examples to help students visualize the language. The lesson includes: Teacher Notes4-pages of SketchNotes completely filled in4-pages of SketchNotes with blanks for students to fill inA 10 question (1 page) Knowledge Check for formative assessmentThe answer key for the Knowledge CheckA
Subjects:
Grades:
10th - 12th, Higher Education
CCSS:
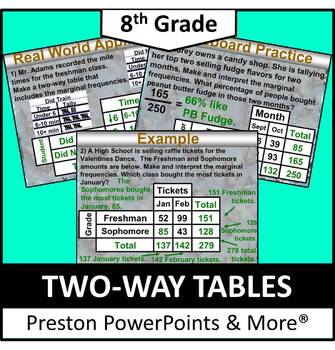
(8th) Two-Way Tables in a PowerPoint Presentation
8th Grade Math (Pre-Algebra) Two-Way Tables in a PowerPoint PresentationThis slideshow lesson is very animated with a flow-through technique. I developed the lesson for my 8th grade class, but it can also be used for upper level class reviews. This lesson teaches how to read two-way tables, make and interpret two-way tables, and use graphs to organize and solve real-life data problems, such as the most liked movie genre.This lesson has SKELETON NOTES, notes that have the problem only. I used t
Subjects:
Grades:
7th - 9th
CCSS:
Statistics Unit 2 Bundle - Frequency Distributions Curriculum (6 days)
This is a unit plan bundle for a Statistics class. The plans include common core math standards, time frame, activities, enduring understandings, essential questions, and resources used. It is designed to last 6 days. The plans include: 21-slide presentation, with annotated guide for reference2 Worksheets"Do Now" Entrance problemsSpreadsheet Activity - "Spreadsheets and Heartbeats"Unit ReviewUnit TestGraphing Calculator instructions included on slidesPacing guide with administrative unit planAll
Subjects:
Grades:
9th - 12th, Higher Education
CCSS:
Showing 1-24 of 427 results


