178 results
Free high school statistics resources for Microsoft PowerPoint

Celebrity Birthday Fun Probability Activity for Pre-Algebra and Algebra classes
This 12 minute narrated, animated PowerPoint presentation makes learning the difference between theoretical probability and experimental or empirical probability fun for students. It is intended for 7th, 8th, or 9th grade Algebra classes. It reviews a few Key terms such as probability, event, sample space, etc. and then concentrates on the famous probability birthday problem or paradox in which given a group of 50 people, 97% will share the same birthday.
Three student handouts are included
Subjects:
Grades:
7th - 10th
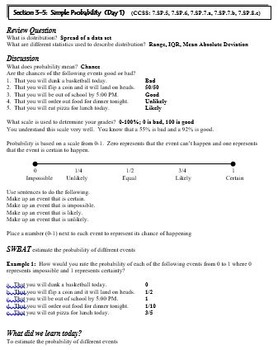
Statistics and Probability: Simple, Theoretical, Experimental, Probability
This is a 7 day lesson plan (powerpoint and hard copy) covering the topics of simple, theoretical, and experimental probability. Each lesson includes a review question, discussion, problems for teacher to model, and problems for the students to try. The lesson plan includes days of instruction, days of practice, assignments, and activities.
Subjects:
Grades:
7th - 9th
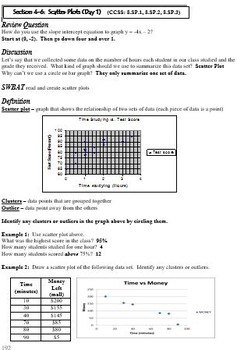
Statistics and Probability: Scatter Plots and Best Fit Lines
This is a 9 day lesson plan (powerpoint and hard copy) covering the topics of scatter plots and best fit lines. Each lesson includes a review question, discussion, problems for teacher to model, and problems for the students to try. The lesson plan includes days of instruction, days of practice, assignments, activities, and a project.
Subjects:
Grades:
7th - 9th

Celebrity Age Scatter Plot Activity
A fun way to gather data for a scatter plot. Students guess celebrity ages and compare to the real age. Plot data on a scatter plot and analyze the correlation. I have my students do this on large sheets of paper in groups with color-coded stickers at the end of 8th grade. This is updated as of May 2018. Ages (and pics) will need to be updated each year. You will probably want to choose a few different celebrities as mine are specific to people students in a Catholic school in Kansas City would
Subjects:
Grades:
6th - 11th
CCSS:

Measures of Central Tendency PowerPoint
Here lies a PowerPoint for a quick review of how to choose the most beneficial measure of central tendency and how to calculate a "wanted" or "missing" piece of data when using mean. This makes a good math center, bellwork, or whole class discussion. Sometimes I use it to pre-test; sometimes for a post-test. ENJOY!
Subjects:
Grades:
7th - 9th

Samples and Populations
This lesson will allow students to understand the concept of Samples and Populations. It has the content and videos which will provide students an engaging lesson. It also has links to an online survey that you as the teacher can conduct and control (This will need to be adapted to suit your specific class). Also included is question examples and activities for the students to engage with. The lesson goes through the following topics: samples, populations, surveys, census questionnaires and coll
Subjects:
Grades:
7th - 9th
CCSS:
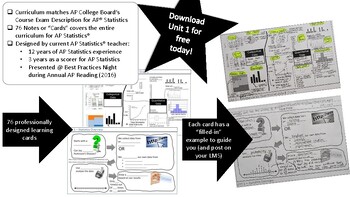
AP Statistics Learning Cards - Unit 1
AP Statistics' Learning Cards for Unit 1 are professionally designed fill-in-the-blank cards that match the AP Statistics Course Description6 cards in unit 1Word documents provide 2 different formats to present to studentsPowerPoint presentation fileAll documents are editable
Subjects:
Grades:
9th - 12th
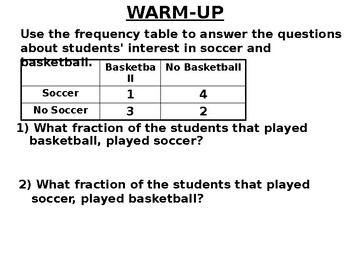
Math 8 19.6 Find the Relative Frequencies of the Data
This editable lesson was written by Alex Benn using the concepts described in his book Tenacious-Teaching: Uniting Our Superpowers to Save Our Classrooms and his website: Tenacious-Teaching.com. It includes an introductory warm-up designed to remediate the required prerequisite knowledge; concise notes; tasks that require escalating effort; numerous examples to prevent misconceptions; and in-class practice problems to promote mastery. It does not include answers to the tasks provided. Those are
Subjects:
Grades:
7th - 9th
Types:
Also included in: Math 8 Unit 19 Fractions, Percents, and Statistics
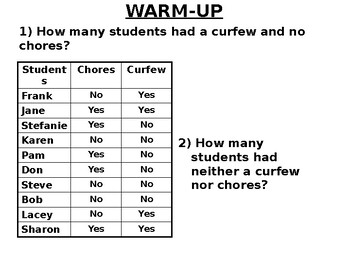
Math 8 19.1 Put Data into Venn Diagrams and Frequency Tables
This editable lesson was written by Alex Benn using the concepts described in his book Tenacious-Teaching: Uniting Our Superpowers to Save Our Classrooms and his website: Tenacious-Teaching.com. It includes an introductory warm-up designed to remediate the required prerequisite knowledge; concise notes; tasks that require escalating effort; numerous examples to prevent misconceptions; and in-class practice problems to promote mastery. It does not include answers to the tasks provided. Those are
Subjects:
Grades:
7th - 9th
Types:
Also included in: Math 8 Unit 19 Fractions, Percents, and Statistics
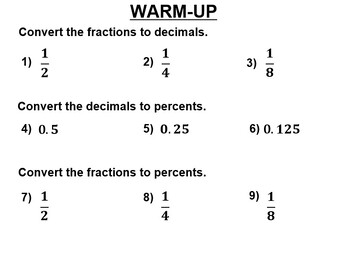
Math 8 19.3 Fractions to Decimals to Percents
This editable lesson was written by Alex Benn using the concepts described in his book Tenacious-Teaching: Uniting Our Superpowers to Save Our Classrooms and his website: Tenacious-Teaching.com. It includes an introductory warm-up designed to remediate the required prerequisite knowledge; concise notes; tasks that require escalating effort; numerous examples to prevent misconceptions; and in-class practice problems to promote mastery. It does not include answers to the tasks provided. Those are
Subjects:
Grades:
7th - 9th
Types:
Also included in: Math 8 Unit 19 Fractions, Percents, and Statistics
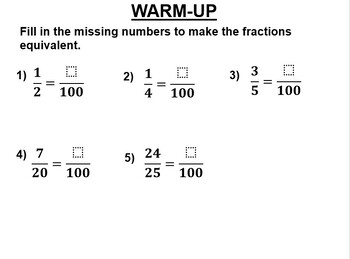
Math 8 19.2 Convert Fractions to Percents
This editable lesson was written by Alex Benn using the concepts described in his book Tenacious-Teaching: Uniting Our Superpowers to Save Our Classrooms and his website: Tenacious-Teaching.com. It includes an introductory warm-up designed to remediate the required prerequisite knowledge; concise notes; tasks that require escalating effort; numerous examples to prevent misconceptions; and in-class practice problems to promote mastery. It does not include answers to the tasks provided. Those are
Subjects:
Grades:
7th - 9th
Types:
Also included in: Math 8 Unit 19 Fractions, Percents, and Statistics
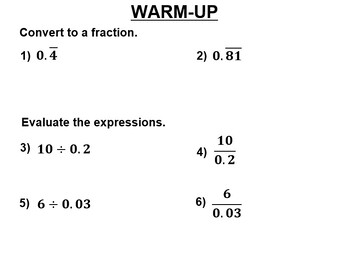
Math 8 19.5 More Repeating Decimals to Fractions
This editable lesson was written by Alex Benn using the concepts described in his book Tenacious-Teaching: Uniting Our Superpowers to Save Our Classrooms and his website: Tenacious-Teaching.com. It includes an introductory warm-up designed to remediate the required prerequisite knowledge; concise notes; tasks that require escalating effort; numerous examples to prevent misconceptions; and in-class practice problems to promote mastery. It does not include answers to the tasks provided. Those are
Subjects:
Grades:
7th - 9th
Types:
Also included in: Math 8 Unit 19 Fractions, Percents, and Statistics
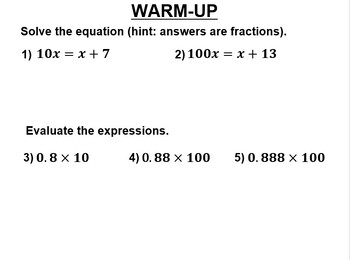
Math 8 19.4 Repeating Decimals to Fractions
This editable lesson was written by Alex Benn using the concepts described in his book Tenacious-Teaching: Uniting Our Superpowers to Save Our Classrooms and his website: Tenacious-Teaching.com. It includes an introductory warm-up designed to remediate the required prerequisite knowledge; concise notes; tasks that require escalating effort; numerous examples to prevent misconceptions; and in-class practice problems to promote mastery. It does not include answers to the tasks provided. Those are
Subjects:
Grades:
7th - 9th
Types:
Also included in: Math 8 Unit 19 Fractions, Percents, and Statistics
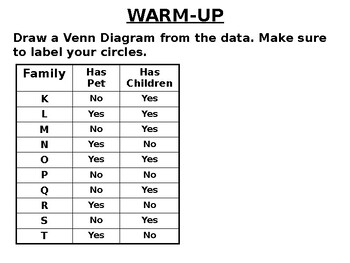
Math 8 Review Unit 19 Fractions Percents Statistics
This editable lesson was written by Alex Benn using the concepts described in his book Tenacious-Teaching: Uniting Our Superpowers to Save Our Classrooms and his website: Tenacious-Teaching.com. It includes an introductory warm-up designed to remediate the required prerequisite knowledge; concise notes; tasks that require escalating effort; numerous examples to prevent misconceptions; and in-class practice problems to promote mastery. It does not include answers to the tasks provided. Those are
Subjects:
Grades:
7th - 9th
Types:
Also included in: Math 8 Unit 19 Fractions, Percents, and Statistics
Culminating Data Collection Project
This project is great for an end-of-semester culminating project. Students will design a study, gather data, then display and describe what they have discovered. As a bonus, you will receive lots of great displays for your classroom!
Subjects:
Grades:
10th - 12th
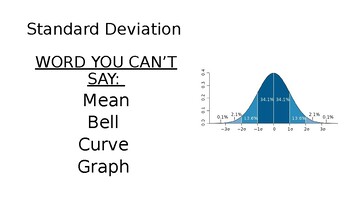
Lecture Slides (Chapter 7) Data, Probabilities, and Predictions
Lecture notes on understanding data, distributions, descriptive statistics, probabilities, predictions, laws of probabilities, the law of large numbers, expectations, payoffs, risk aversion, conditional probability, statistical inference, and some applications in sustainability and environmental modeling.
Subjects:
Grades:
10th - 12th, Higher Education

AP - X-Files PowerPoint
This is the PowerPoint I use to explain the X-files lab. It has a video at the end from X-files the movie. I've also uploaded the soundtrack to the title slide.
Subjects:
Grades:
10th - 12th
Stem-and-Leaf Plots and Histograms
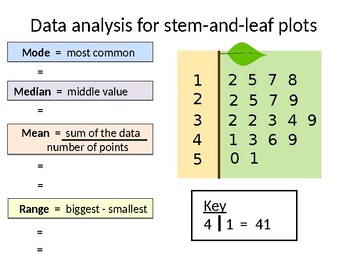
This is PowerPoint presentation that covers stem-and-leaf plots and histograms at a year 9 extension level. I used it for three lessons, with the cut offs being the starter activities, but you can edit the slides as you wish to suit your class.For the M&M activity students were given party packs of M&Ms and asked to count how many of each colour. They then constructed bar graphs of the data to analyse the shape.
Subjects:
Grades:
9th - 12th
Types:

Real Numbers
Much of this material should be familiar to you, but some of it may be new. Although it is only a language or set of rules to help you deal with statistics, without it you will not be able to make sense of the following chapters. Before you continue, make sure you have completed all the learning activities and understood what you have done.
Subjects:
Grades:
7th - 9th

Intro to Mean Absolute Deviation
This PowerPoint explains what mean absolute deviation is and how to find it. Gives some easy practice sets for students. I created this while teaching 6th grade mathematics to help my students understand the concept. My district required me to introduce the topic, and wanted students to have a general understanding of how to find the mean absolute deviation, so the PowerPoint does not go too deep.
Subjects:
Grades:
6th - 9th
Probability and Stats Unit A Powerpoint
High School Probability and Statistics (basic level) - Unit A One Variable Statistics (5 units in the course)
Subjects:
Grades:
9th - 12th
Types:

Averages and Range Activity: Build an Army
“Build an Army” is a series of strategy games which can help make a wide range of topics in mathematics more engaging and challenging for all ages and ability levels
As well as helping to develop key skills, students are also encouraged to develop problem solving strategies, which will be useful in all areas of their mathematics.
The activities can be edited and adapted to suit the needs of your students
Each document contains a Build an Army activity, full instructions how to run it in the c
Subjects:
Grades:
4th - 9th
Types:
Showing 1-24 of 178 results


