117 results
High school statistics resources for Microsoft PowerPoint $10 and up
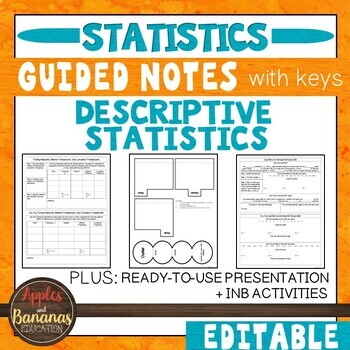
Descriptive Statistics- Guided Notes, Presentation, and INB Activities
This Introduction to Statistics product is flexible, editable, and can be used for in-person or distance learning. Take the time and stress out of creating your own guided notes and presentations. There are many ways to use this engaging bundle. It includes guided notes embedded with student practice problems (keys included), foldable activities, and a PowerPoint presentation for focused instruction. Choose what works best for your class/student and modify to make the content fit your needs. Not
Subjects:
Grades:
9th - 12th
CCSS:
Also included in: Custom Bundle for Viet
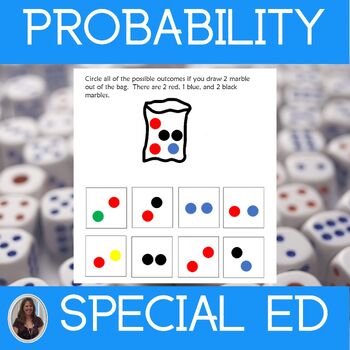
Chance & Probability Math Worksheets Special Education Statistics & Probability
This unit on Chance and Probability contains printable and digital math worksheets for special education. This statistics and probability unit is for students who take alternate assessments.This Chance and Probability unit helps students understand how to determine the probability of an event and all its possible outcomes. The worksheets, which use pictures and color coding, are differentiated. There are many ways for students to practice these skills in this unit that are at different levels.
Subjects:
Grades:
7th - 9th
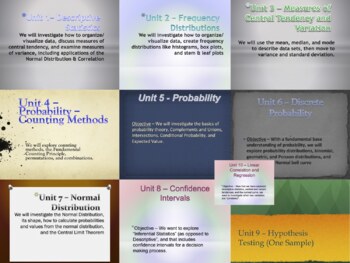
A Mountain of Statistics Curriculum - One Full Year Bundle
This is a bundle of 10 Units, Midterm Exam, & Final Exam designed for a high school Statistics Class (can be applied to University discipline). Each unit plan includes Common Core Standards, Key Concepts/Enduring Understandings, Essential Questions/Do Now, Activities, Resources, Procedures, and Assessment techniques. It is designed to be a lifelong tool that you can add to, edit, and re-use every year! Please see each Unit Statistics Product in the MountainWorks Store (sold separately) for
Subjects:
Grades:
9th - 12th, Higher Education
Statistics Curriculum Statistics and Probability Special Ed Math Curriculum
Save $$$ with this Statistics Curriculum. This special ed math curriculum contains 8 units from my series on statistics including statistics and probability. They were developed for students with autism and special learning needs in middle and high school. Each unit is structured in the same way with similar content to enable your students to make connections and build on what they learn in each unit. This repetition of format helps ease anxiety and free up mental space when learning more di
Subjects:
Grades:
8th - 10th
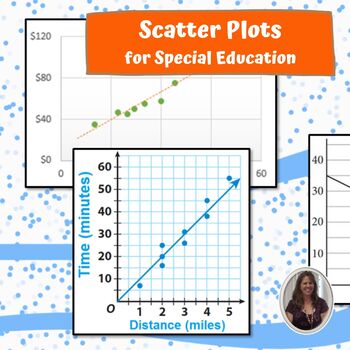
Scatter Plots for Special Education PRINT AND DIGITAL
This unit on Scatter Plots has almost 200 pages and 72 slides of material specifically designed for students with special learning needs, especially autism who are in middle and high school. This unit focuses on helping students interpret and read scatter plots. There are differentiated versions of the worksheets that use pictures and color coding. There are many, many worksheet for students to practice in this unit that are at different levels. There are MANY opportunities for students to e
Subjects:
Grades:
8th - 10th
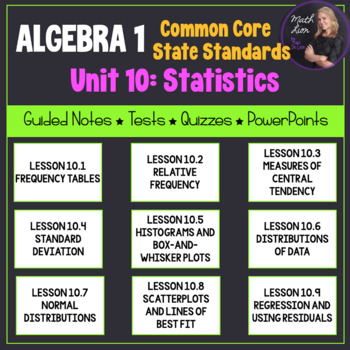
Statistics (Algebra 1 Curriculum - Unit 10) | Bundle for Common Core
This is a great unit that covers a Statistics unit in an Algebra 1 course! 9 lessons are included!All documents are EDITABLE!Included:- Overview of the common core alignment (PDF)- Guided notes for 9 lessons (PDF and Word)- PowerPoints that coordinate with the guided notes (PPTX)- Mid-Unit Quiz (PDF and Word)- Unit Test (PDF and Word)-Pacing Guide (PDF and Word)Each lesson contains a learning scale, warm up (do-now or bell ringer), key concepts, vocabulary, and examples for students to follow w
Subjects:
Grades:
7th - 12th
CCSS:
Goldie's AP® Statistics Review Lessons and Homework
AP StatisticsUnit Review Lessons and Homework Assignments You can use these resources:throughout your year in AP Statistics, as a way to review before quizzes and testsas end of the year AP Exam reviewas an independent study guide resource for students Note: These resources are included in their respective unit plans. You get a total of 21 individual resources in this amazing bundle. There are 9 units in the AP Statistics course, and each unit comes with the following:PowerPoint presentation rev
Subjects:
Grades:
11th - 12th
High School Math Topics: STATISTICS & PROBABILITY
This is a collection of 19 Powerpoint Presentations to clearly explain STATISTICS and PROBABILITY topics in high school Math. These are also available individually, and also as part of the complete "Math Topics for High School Math" Product- also available elsewhere in my shop on this site.I sell these materials commercially for a much higher price, so these are very heavily discounted to allow all teachers to be able to access these for their own use.The titles of the 19 powerpoints are:Averag
Subjects:
Grades:
8th - 11th
Types:
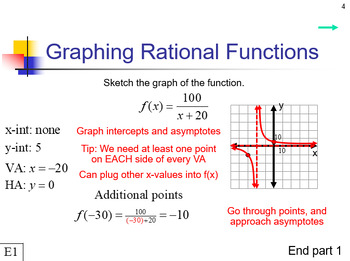
Algebra 2 Honors Course
Bundle of resources for an Algebra 2 Honors Course. Includes the following (note that all resources can be edited, equations may require MathType):8 Chapters (see this Course Page for the full breakdown and companion YouTube videos)1 Functions2 Factoring3 Complex Numbers4 Quadratics5 Polynomials6 Rational Functions7 Trigonometry8 Statistics and ProbabilityEach lesson includes:PowerPoint presentation for the lesson itselfWord Guided Notes to go with lessonWord handouts for two homework assignment
Subjects:
Grades:
9th - 12th
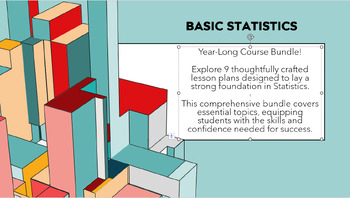
Basic Statistics Year Long Lesson Plan Bundle
Prepare to embark on an exhilarating journey through the realm of statistics with our meticulously crafted nine-lesson plan designed to engage and captivate your students' minds. Each session is a vibrant exploration of statistical concepts, infused with excitement, interactivity, and depth. From introducing the basics of data analysis to delving into advanced techniques, our lessons are brimming with hands-on activities, animated discussions, and real-world applications that will ignite a passi
Subjects:
Grades:
11th - 12th, Staff
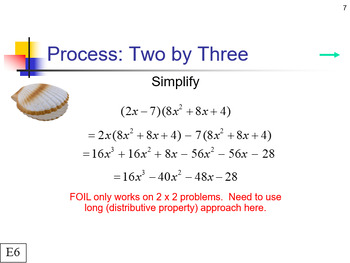
Algebra 2 CP Course
Bundle of resources for an Algebra 2 CP Course. Includes the following (note that all resources can be edited, equations may require MathType):8 Chapters (see this Course Page for the full breakdown and companion YouTube videos)1 Systems of Linear Equations2 Factoring3 Complex Numbers4 Quadratics5 Polynomials6 Rational Functions7 Trigonometry8 Statistics and ProbabilityEach lesson includes:PowerPoint presentation for the lesson itselfWord Guided Notes to go with lessonWord handouts for two homew
Subjects:
Grades:
9th - 12th
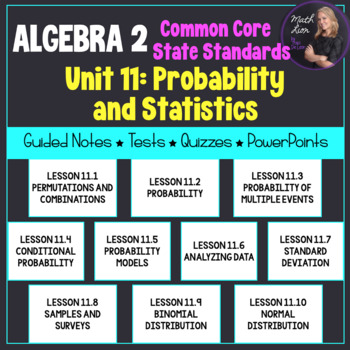
Probability and Statistics (Algebra 2 - Unit 11) | Math Lion
Documents are editable!!! This unit includes PowerPoint presentations, coordinated guided notes with answers, a mid-unit quiz, and unit test covering Probability and Statistics Functions. The PowerPoint includes warm ups (do-now or bell ringer), key concepts, and examples for students to follow. 10 lessons included! The lessons are 30 - 45 minutes each. 11.1: PERMUTATIONS AND COMBINATIONS 11.2: PROBABILITY 11.3: PROBABILITY OF MULTIPLE EVENTS 11.4: CONDITIONAL PROBABILITY 11.5: PROBABILITY MODEL
Subjects:
Grades:
9th - 12th
CCSS:
Also included in: Algebra 2 Unit Plans 9-12 (Bundled) | Math Lion
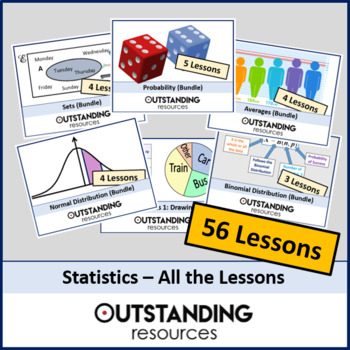
Statistics ALL LESSONS
This is 56 whole lessons with ALL additional resources included! Below is a list (alphabetical) of precisely what lessons are included. If you want more information then all individual lessons are available in my shop and maybe it might be worth buying one or two before purchasing this fantastic bundle. 1. Averages 1 - Mode, Median and Mean2. Averages 2 - comparing the different averages3. Averages 3 - Grouped Data (Estimated Mean) 4. Averages 4 - Mean vs Estimated Mean5. Bar Charts and Compara
Subjects:
Grades:
6th - 12th, Higher Education
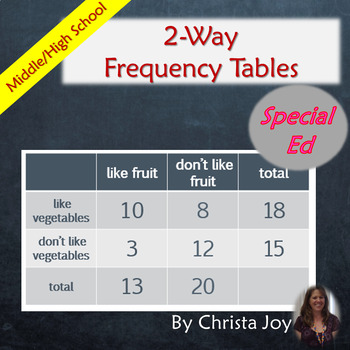
2-Way Frequency Tables for Special Education PRINT AND DIGITAL
This unit on 2-Way Frequency Tables has almost 200 pages and 76 google slides of material specifically designed for students with special learning needs, especially autism who are in middle and high school. This unit focuses on helping students interpret, read, and create 2-Way Frequency Tables as well as Venn Diagrams. There are differentiated versions of the worksheets that use pictures and color-coding. There are many, many worksheet for students to practice in this unit that are at differ
Subjects:
Grades:
8th - 10th

Surveys Creating and Conducting for Special Education PRINT AND DIGITAL
This unit on Surveys has almost 200 pages and 56 googles slides of material specifically designed for students with special learning needs, especially autism who are in middle and high school. This unit focuses on helping students understand what makes a good survey, how to give one, and how to understand and present the results. There are differentiated versions of the worksheets that use pictures and color-coding. There are lots of ways for students to practice these skills in this unit tha
Subjects:
Grades:
9th - 11th
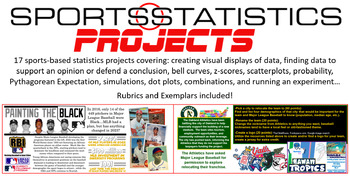
Sports Statistics - Projects ONLY! 17 projects in all
Most of the projects allow students to choose their own topic to display their understanding of statistical topics. Students will:Create a graph of their choosing given dataDesign an infographic on the subject of their choosingResearch and defend their G.O.A.T. choice in a variety of categoriesUse demographics to relocate and rebrand a professional franchiseResearch social injustices in sports and display the dataCreate a bell curve based on career statistics of Michael JordanCompare the salari
Subjects:
Grades:
8th - 12th
CCSS:
IB Psychology Internal Assessment (IA) Analysis and Statistics Slides
Walk your students through the Analysis section of the Internal Assessment (IA). Google slides include content and background information on statistics, directions and links for students to follow while they write their Analysis section, create their table and graph, and run descriptive statistics and inferential statistics with their raw data. Includes links to online calculators for mean, standard deviation, Mann Whitney U Test, Wilcoxon Test. Analysis rubric and links to two IA exemplars incl
Subjects:
Grades:
9th - 11th, Higher Education, Adult Education
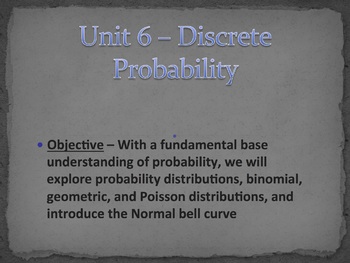
Statistics Unit 6 Bundle - Discrete Probability (12 days)
This is a unit plan bundle for a Statistics class. The plans include common core math standards, time frame, activities, enduring understandings, essential questions, and resources used. It is designed to last 12 days, depending on pacing. The plans include: 39-slide presentation, with annotated guide for reference3 Worksheets"Do Now" Entrance problems2 quizzesSpreadsheet Activity - Binomial, Geometric, Poisson DisributionsReview slides (for student-group communicators)Unit test (with review pac
Subjects:
Grades:
9th - 12th, Higher Education
CCSS:
Probability and Statistics PowerPoints
This is an expanding bundle of PowerPoints created for an Intro Prob & Stats class. As I continue to modify and upload PowerPoints, I will continue to add them to this bundle.Basics of Statistics (17 slides) - this Power Point includes some of the basic vocabulary of statistics, including the concept of population and sample, distinguishing between parameters and statistics, descriptive and inferential statistics, types of data and the levels of measurement for data, the design of a statist
Subjects:
Grades:
10th - 12th, Higher Education
Types:
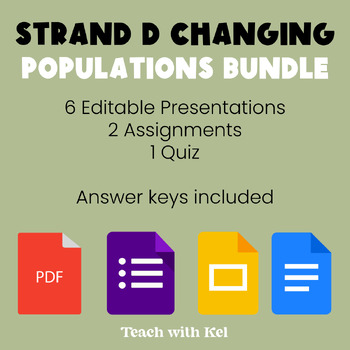
Grade 9 Geography STRAND D: Changing Populations Unit Bundle
This STRAND D: Changing Populations Bundle is a perfect fourth unit for Grade 9 Canadian Geography and includes over 100 slides of content, one quiz, and two bonus assessment activities! The bundle includes 6 products total. Answer keys are include for all quizzes and assessments. Content includes: Population trends in Canada, Immigration Trends in Canada, and Population Characteristics!! Bonus content includes 12 Kahoot Links to use as a study tool. Play as a class or students can challenge the
Subjects:
Grades:
7th - 10th
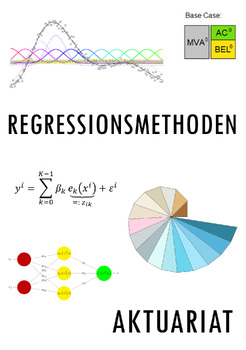
Regressionsmethoden im Aktuariat (Präsentationsfolien)
Lernziel: Überblick über verschiedene Regressionsmethoden, Machine Learning Ansätze und künstliche neuronale Netze sowie Transfer der Theorie auf eine praktische Anwendung im Risikomanagement von VersicherungsunternehmenIn diesen Präsentationsfolien werden diverse adaptive Machine Learning Ansätze ausgehend von der Methode der kleinsten Quadrate und Modellwahlkriterien zur Herleitung der Verlustfunktion (sog. "Proxyfunktion") eines Lebensversicherers in Abhängigkeit seiner Risikofaktoren (z.B.
Subjects:
Grades:
11th - 12th, Higher Education, Adult Education
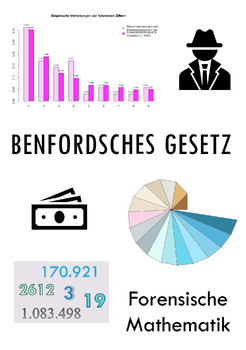
Benfordsches Gesetz (Präsentationsfolien + R Code)
Lernziel: Umgang mit dem Benfordschen Gesetz und Einblick in die "Forensische Mathematik", Transfer der Theorie auf praktische Anwendungen in der Wirtschaftskriminalität, Programmierung in statistischer Software RDas Benfordsche Gesetz zeigt, wie Forensische Mathematik dazu beitragen kann, Betrug aufzudecken. Es ist ein wichtiges Instrument, um z.B. Wirtschaftskriminalität oder auch andere Fälle von Datenfälschungen aufzuspüren. Das Benfordsche Gesetz verblüfft, ist anwendungsbezogen und eignet
Subjects:
Grades:
11th - 12th, Higher Education

Statistics animated powerpoint lesson template
Content:1.Introduction2.Discrete Data3.Continuous Data4.Central Tendancy of a Data Set5.Range and Interquartile Range6.Box and Whisker Plot
Subjects:
Grades:
8th - 9th

Statistics Module Bundle
Dear Customers!This Statistics Module Bundle file contains 18 lectures which are covered during Statistics Module.Each lecture containing:- Lecture PPT- Test Bank with answers for each lecture - Exercises for seminars/lectures with answers
Subjects:
Grades:
6th - 12th, Higher Education, Adult Education, Staff
Showing 1-24 of 117 results


