16 results
High school statistics images under $5
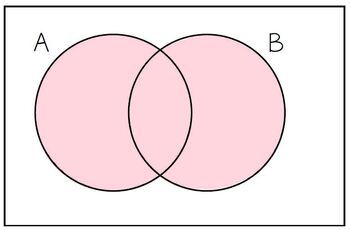
Probability Venn Diagram Images
In this file, you will get 8 images of 2 circle Venn diagrams and 8 images of 3 circle Venn diagrams. There is also a PDF with all theimages together. These are perfect to add to notes, worksheets, or assessments.
Subjects:
Grades:
9th - 12th, Higher Education
Types:
Creating a Box Plot Steps
This product can be used as a resource for guided practice, notes, and/or as a scaffold. I love having my students glue it into their resource notebook so that they have it readily available to look back at whenever they want!Through an example, this graphic organizer includes steps on how to enter a list of data into the TI-84 Graphing calculator to find the 5 number summary. Then, it shows students how to interpret the 5 values and use them to draw a box plot on a number line.
Subjects:
Grades:
7th - 12th
CCSS:
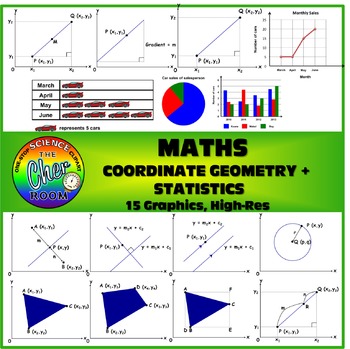
MATH Clipart: Coordinate Geometry and Statistics
15 Graphics on Coordinate Geometry and Statistics
You'll find diagrams that illustrates the following:
Gradient
Mid Point
Point at a ratio
Area of geometry
pi chart
pictogram
bar chart
line graph
This product is allowed for both personal and commercial use, but credit must be given to my store: https://www.teacherspayteachers.com/Store/The-Cher-Room
Subjects:
Grades:
7th - 12th

Statistics/Math 2 SBG Proficiency Level Descriptor S.CP.6 Image
Jpeg images for the Integrated Math 2 common core state standards that describe 1) the standard and 2) the rubric outlining four proficiency levels.Useful for assignments, posters, presentations, etc. to offer transparency of expectations to students and an easier breakdown for teacher grading.The file download will not have a black outline.
Subjects:
Grades:
9th - 11th
Types:
CCSS:

Statistics/Math 2 SBG Proficiency Level Descriptor S.CP.4
Jpeg images for the Integrated Math 2 common core state standards that describe 1) the standard and 2) the rubric outlining four proficiency levels.Useful for assignments, posters, presentations, etc. to offer transparency of expectations to students and an easier breakdown for teacher grading.The file download will not have a black outline.
Subjects:
Grades:
9th - 11th
Types:
CCSS:
Statistics Test Review: Inferences About the Slope
Statistics test review covering:
• Confidence intervals
• Correlation of determination
• Prediction & estimation
Students will review learned concepts of inferences about the slope. This review will give students an idea of what concepts they have mastered and what areas they need additional help on to achieve mastery.
• Answer Sheet Included •
===================================================
Related Items:
• Statistics Worksheet: Inferences About the Slope
• Statistics Worksh
Subjects:
Grades:
10th - 12th
Types:
Also included in: Statistics Bundle: Year Long Curriculum
Scatter Plots Anchor Chart
Includes several examples of vocabulary for scatter plots (cluster, positive correlation, line of best fit, etc.)
Subjects:
Grades:
8th - 9th
Types:
CCSS:

Statistics Worksheet: Inferences About the Slope
Statistics worksheet covering:
• Inferences about the slope
You will receive a worksheet as well as fill in the blank notes with the purchase of this resource. Students will practice the necessary skills of inferences about the slope to be successful in Statistics.
• Answer Sheet Included
===================================================
Related Items:
• Statistics Worksheet: Inferences About the Slope
• Statistics Worksheet: Correlation of Determination
• Statistics Worksheet: Predi
Subjects:
Grades:
10th - 12th
Types:
Also included in: Statistics Bundle: Year Long Curriculum
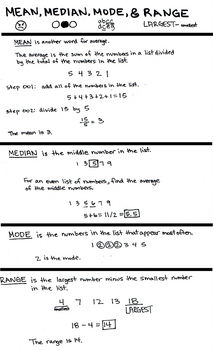
Basic Statistics: Mean, Median, Mode, and Range
An easy guide to learn Mean, Median, Mode, and Range.
Subjects:
Grades:
3rd - 12th
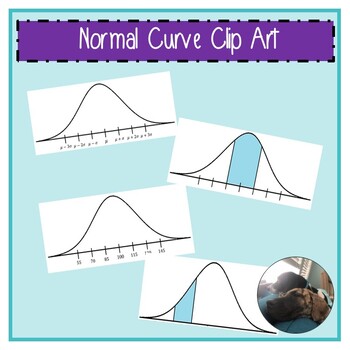
Normal Curve Clip Art
This product contains 23 different images. They include a blank curve with marks, a blank curve with generic labels, 68/95/99.7 shaded and unshaded with marks and labels, 3 different shading between 2 values, 2 different shadings to the left of a value, 2 different shadings from the right of a value, and an IQ normal curve. You will receive these images as a zip file. These images were created starting with this base image.These images can be used in personal & commercial use. If they are us
Subjects:
Grades:
11th - 12th, Higher Education
Types:
Statistics Test: Inferences About the Slope
Statistics test covering:
• Confidence intervals
• Correlation of determination
• Prediction & estimation
Students will test their knowledge over learned concepts of inferences about the slope. This test will give students an idea of what concepts they have mastered and what areas they need additional help on to achieve mastery.
• Answer Sheet Included •
===================================================
Related Items:
• Statistics Worksheet: Inferences About the Slope
• Statisti
Subjects:
Grades:
10th - 12th
Types:
Also included in: Statistics Bundle: Year Long Curriculum
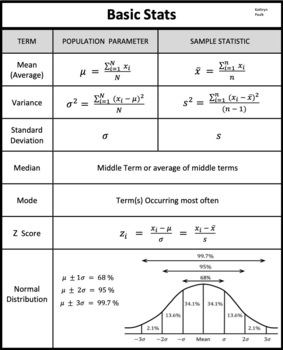
Basic Statistics (JPG)
Basic Statistics, Population and Sample Parameters, Mean, Median, Mode, Variance, Standard Deviation, Normal Distribution.
Subjects:
Grades:
6th - 12th, Adult Education
Types:
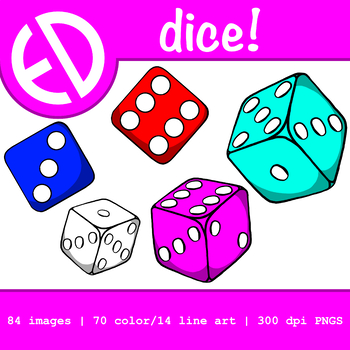
Dice Clip Art
This pack of clip art contains dice in the colors white, red, teal, blue, and pink. There are two varieties of these colored dice. One is a cube form dice and the other is a top face view dice. There are one cube form and one top face of each number for each color. There are a total of 84 clip arts. 14 of these are black and white line arts of each dice form. The remaining 70 are split between colored top face dice and colored cube form dice.These colorful dice can be used easily in learning to
Subjects:
Grades:
PreK - 12th, Higher Education, Adult Education, Staff, Not Grade Specific
Types:
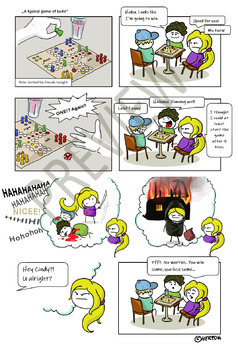
Cumulative binomial distribution - an editable comic (black humor, stochastics)
Hi there,Greetings from Germany!You'll get an editable comic, that you can use to start your math lesson in a different way. I thought it'd be an entertaining way to connect everyday life with the binomial distribution. But maybe you'll find a way to use it in other fields.Fill in the speechbubbles as you like - or leave them empty, so that the students can get creative :)I recommend this comic only for higher grades.
Subjects:
Grades:
9th - 12th
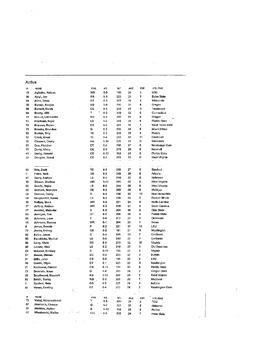
Super Bowl LII
This asks students to use the team rosters from the Eagles and the Patriots to find measures of central tendency: height, weight, age, years of experience. Students can work alone or in groups.
Subjects:
Grades:
6th - 12th
Types:

Displaying Data
Stem and Leaf Plots, Mean, Median, Mode, Box-and-Whisker, Line Plot, and Frequency Tables
Subjects:
Grades:
7th - 10th, Adult Education
Types:
Showing 1-16 of 16 results


