53 results
High school statistics resources for Microsoft Excel under $5
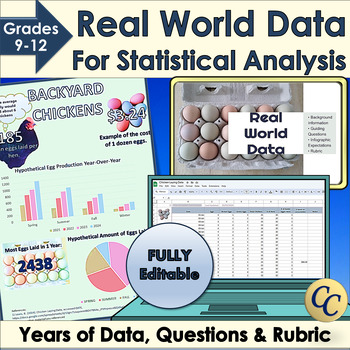
Real World Data for Statistical Analysis and Infographic Project
Give your students access to real world data for your statistical analysis unit or data literacy! Dive into statistics with Microsoft Excel™ or Google Sheets™ and years of data. Learn how to use standard deviation, mean or median to interpret data. Choose the best graphs to display conclusions in an infographic. Works great for science fairs! ✔ Includes an infographic project! (Template, expectations, and rubric). ✔ Everything is fully editable and you and your students can even use the images
Grades:
9th - 12th
Types:
CCSS:
Printable Graph Paper 10 Squares Per Inch Cross Stitch
Printable Graph Paper 10 Squares Per Inch Cross Stitch - Grid paper is essentially the type of paper most commonly used for drawing and sketching purposes. It is widely used for making plan charts, designing websites, developing home ideas and so forth. A great deal of businesses who need to produce a company card, business brochures, catalogues, brochures, and so forth need this kind of graph paper.
Subjects:
Grades:
5th - 12th

Water Balloon Catcher Project - Data and Graphing - Mathematics
Transform your maths classroom into a dynamic hub of learning with this captivating data and graphing project! Designed for upper primary/middle school students, this hands-on and inquiry-based activity ensures an immersive experience in mastering data interpretation, chart creation, and understanding the role of data and graphs in advertising.In this engaging project, students will: Explore Data: Collaborate in teams to design and construct a Water Balloon Catcher using recycled materials, each
Subjects:
Grades:
5th - 9th
Types:
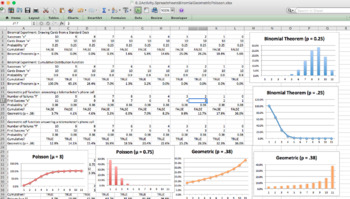
Statistics Spreadsheet Activity - Binomial, Geometric, Poisson (2 days)
Statistics Spreadsheet Activity - Binomial, Geometric, Poisson (2 days) This is a 1-2 day spreadsheet activity for a Statistics class. It uses spreadsheets as a walkthrough to allow students to explore the Binomial, Geometric, and Poisson distributions, as well as create graphs of the distributions. The product includes: 6.3 Spreadsheet Activity (Also included in " Statistics Unit 6 Bundle - Discrete Probability (12 days)" and in " A Mountain of Statistics Curriculum - One Full Year Bundle")Exce
Subjects:
Grades:
9th - 12th, Higher Education
Types:
CCSS:
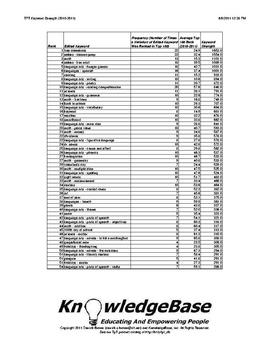
TPT KeyWord Strength Index (2010-2011) - Downloadable Spreadsheet!
What are the strongest keywords on TpT?
1. free downloads
2. Deanna Jump
3. math
Neither #1 nor #2 are surprises, but #3 (math) was certainly a surprise to me!
This report analyzes TpT's 2010-2011 keywords using a measure called "keyword strength".
The measure is based on a keyword's average rank, as well as the number of times it appeared in the 2010-2011 "Top 100" TpT search engine rankings.
This can be a valuable tool to help sellers understand TpT's marketplace supply and demand!
The P
Subjects:
Grades:
PreK - 12th, Higher Education, Adult Education, Staff
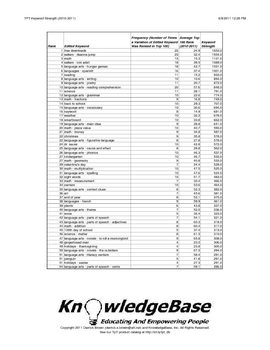
TPT KeyWord Strength Index (2010-2011) - Downloadable PDF!
What are the strongest keywords on TpT?
1. free downloads
2. Deanna Jump
3. math
Neither #1 nor #2 are surprises, but #3 (math) was certainly a surprise to me!
This report analyzes TpT's 2010-2011 keywords using a measure called "keyword strength".
The measure is based on a keyword's average rank, as well as the number of times it appeared in the 2010-2011 "Top 100" TpT search engine rankings.
This can be a valuable tool to help sellers understand TpT's marketplace supply and demand!
The P
Subjects:
Grades:
PreK - 12th, Higher Education, Adult Education, Staff
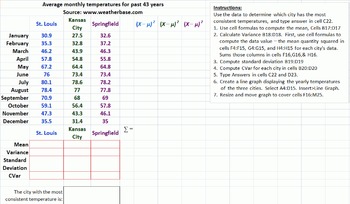
Standard Deviation Activity - Temperatures - Bluman 3-3
This is an Excel activity for students that has them compute the standard deviation and determine which cities have the most consistent temperatures. There is a worksheet for Missouri, New York, and South Carolina. Each worksheet has three major cities and the average monthly temperature. There is also a completed project so that you can compare the formulas used. In the Missouri worksheet, students find standard deviation by using sums, and taking the square root of the variance. In the s
Subjects:
Grades:
10th - 12th
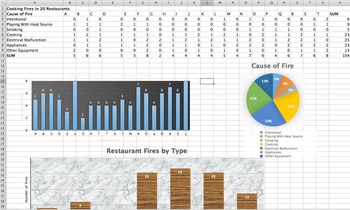
Statistics Project Unit 3 Spreadsheets Mean Median Mode Std. Deviation (2 day)
This is a 1-2 day project aimed at introducing a statistics class to Excel (or Numbers) who are familiar with Pie Charts, Bar Charts, Measures of Central Tendency, and Standard Deviation. The students will input data (included) into Excel (on fires in restaurants), form their own Bar Charts and Pie Charts, and be able to input formulas into the Excel to automatically calculate statistics. Students will be given the opportunity to explore different charts and design their charts to make them colo
Subjects:
Grades:
9th - 12th, Higher Education, Adult Education
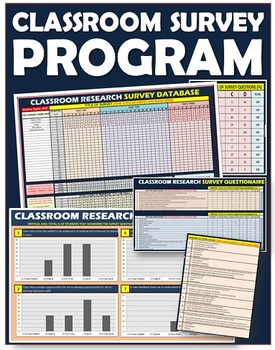
Surveys: Classroom All-IN-ONE Research Program
Empower Your Teaching with Data: Enhance Your Classroom with Powerful Survey Analysis!Elevate your teaching practice by leveraging the power of data with this user-friendly survey analysis program.Here's what sets it apart:Effortless Data Visualization: Transform survey responses into clear and visually appealing charts and graphs.Actionable Insights: Gain valuable insights into student learning styles, preferences, and areas for improvement.Informed Decisions: Make data-driven decisions to enha
Subjects:
Grades:
PreK - 12th, Higher Education, Adult Education, Staff
Types:
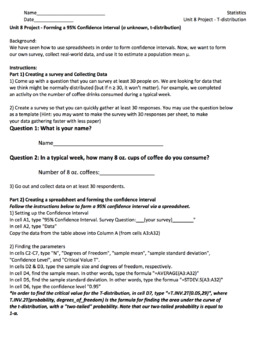
Statistics Unit 8 Project - Surveys, Confidence Intervals, Spreadsheets (3 days)
This is an end-of-unit project with Confidence Intervals for a Statistics class. Students will work together to create a survey, gather real-world data, create a spreadsheet, perform a confidence interval analysis to estimate the population mean μ, and create a Powerpoint presentation to present to class. The Product includes: Instructions for studentsTeacher instructions Excel spreadsheet with samplesGrading Rubric *The topics covered are Confidence Intervals, T-distribution, spreadsheets, pres
Subjects:
Grades:
10th - 12th, Higher Education
Types:
CCSS:
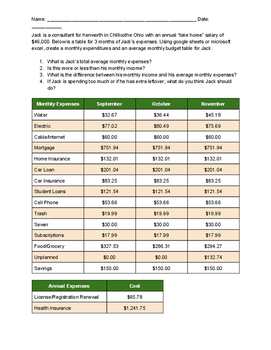
Budget Sheet Assignment
This sheet is a mock example of a person's expenses over the course of three months. It asks students to use technology like excel or google sheets to create tables of expenses. Then compare those tables with an average monthly spending budget sheet. This is mainly to be used to have students practice entering data into the spreadsheet and use the "sum" and "average" equations in the spreadsheet. Afterwards, the students can compare the expenses with the income to see if the budget is over or un
Subjects:
Grades:
9th - 12th
Types:
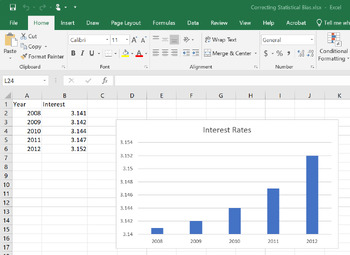
Correcting Statistical Bias with Answer Key
Correcting Statistical Bias is a great tool to use when teaching about statistical bias in the media, news, sports, and politics.It includes 4 graphs that have been manipulated to show bias.You can get your students to practice un-manipulating the graphs using the provided hints to show the real story behind the data and help your students to become more statistically aware.
Subjects:
Grades:
8th - 12th
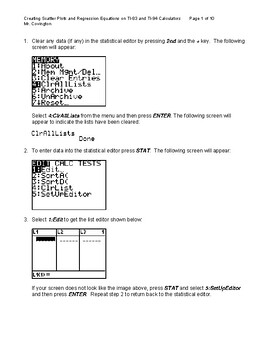
Creating Scatter Plots and Lines of best fit on TI-83/84 Graphing Calculator
A tutorial and reference guide for working with two-variable data to generate scatter plots and least squares method line of best fit on TI-83/84 graphing calculators and Microsoft Excel.
Subjects:
Grades:
8th - 12th, Higher Education, Adult Education
Types:
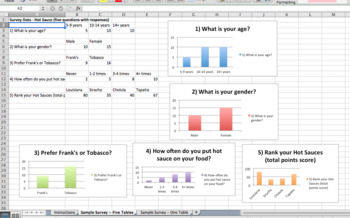
Statistics Unit 1 Project - Gathering Data (3 days)
This is an end-of-unit project for a Statistics class. It is introductory into survey methods, gathering data, using spreadsheets to organize data, creating charts, and presenting findings to the class. The Product includes: Instructions for studentsTeacher instructions for guidance on use and editingExcel spreadsheet with samplesGrading Rubric *The topics covered are survey methods - simple random, stratified, convenience, cluster, systematic - spreadsheets, charts, and presentations. The docum
Subjects:
Grades:
10th - 12th, Higher Education
Types:
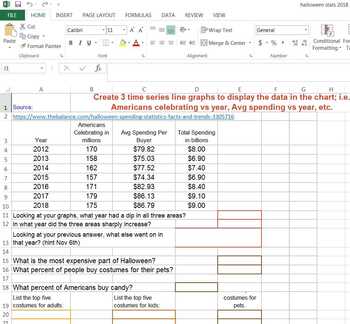
Halloween Statistics 2018 Spreadsheet Activity
If you are teaching stats and incorporating spreadsheets, this might fit the bill for a fun activity for Halloween. The plus is it does have some educational value, as well as a fun Mystery Image sheet, as well. Students go to a website and read statistical information, then they create line graphs and answer questions in the first spreadsheet. In the second, they are just practicing their spreadsheet formatting skills by following step-by-step instructions to create an image. There are two
Subjects:
Grades:
7th - 12th
Types:
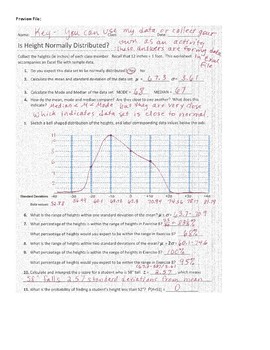
Is it normal? Height Data Activity
This activity was created to help introduce students to normal data distributions. This file contains an Excel workbook with instructions (for both 2010 and 2013 versions of Excel) for students to do the following:
Find the Mean, standard deviation, median, mode, and the distribution of data within a certain number of standard deviations from the mean.
Create bar graph and line chart of frequencies.
Answer questions regarding data on separate Worksheet.
This activity is totally editable, so you
Subjects:
Grades:
9th - 12th
Types:
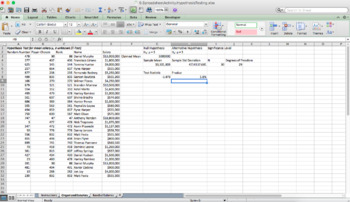
Statistics Unit 9 Spreadsheet Activity - Hypothesis Testing, VLOOKUP, T-Test
This is a 2 day spreadsheet activity for a Statistics class. It uses spreadsheets as a walkthrough to allow students to organize data, form a hypothesis, find the T-statistic and p-value and use the decision criterion. The activity uses VLOOKUP, RANDBETWEEN, AVERAGE, STDEV.S, ABS, SQRT, and TDIST built-in spreadsheet functions. The product includes: Unit 9 Spreadsheet Activity (in xlsx format)Teacher instructionsAnswer Key included. *The topics covered are Hypothesis Testing, One Sample T-Test,
Subjects:
Grades:
10th - 12th, Higher Education
Types:
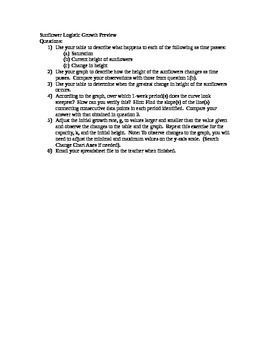
Logistic Growth Rate Project with spreadsheet or Google sheets.
This project uses sunflower growth to help students generate a logistic growth model. There are numerous video links to sunflower growth and time lapse videos of growth. Students examine saturation points as well as a way to understand that sunflowers can not get infinitely tall.Includes Smart Notebook presentation, starter Excel spreadsheet, and student direction sheet.
Subjects:
Grades:
10th - 12th
Types:
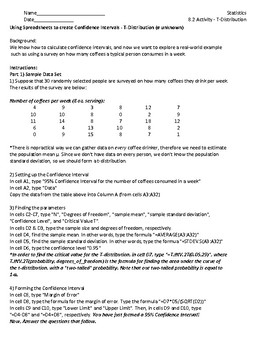
Statistics Unit 8.2 Spreadsheet Activity - Confidence Intervals, T-distribution
This is a 1 day spreadsheet activity for a Statistics class. It uses spreadsheets as a walkthrough to allow students to explore the T-distribution, and form a 95% confidence interval from a data set. The product includes: 8.2 Spreadsheet Activity (in xlsx format)Teacher instructionsAnswer Key included. *The topics covered are Confidence Intervals (σ unknown), T-distribution, "AVERAGE", "STDEV.S", and "T.INV.2T" functions. The documents are Excel based, pdfs included, and completely editable. En
Subjects:
Grades:
10th - 12th, Higher Education
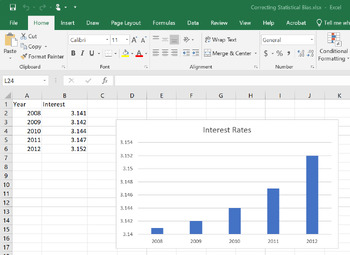
Correcting Statistical Bias
Correcting Statistical Bias is a great tool to use when teaching about statistical bias in the media, news, sports, and politics. It includes 4 graphs that have been manipulated to show bias.You can get your students to practice un-manipulating the graphs using the provided hints to show the real story behind the data and help your students to become more statistically aware.
Subjects:
Grades:
8th - 12th
Also included in: Correcting Statistical Bias with Answer Key
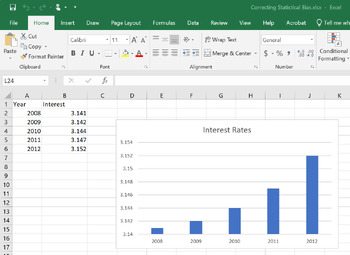
Correcting Statistical Bias Answer Key
This resource provides the answers for you and your students for the Correcting Statistical Bias lesson.
Subjects:
Grades:
8th - 12th
Also included in: Correcting Statistical Bias with Answer Key
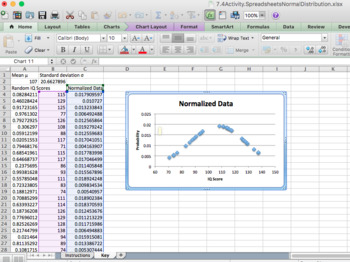
Statistics Spreadsheet Activity - Normal Distribution (1 day)
This is a 1 day spreadsheet activity for a Statistics class. It uses spreadsheets as a walkthrough to allow students to explore the Normal Distribution, as well as use the RAND function to simulate IQ scores to generate Normal data. The product includes: 7.4 Spreadsheet Activity (in xlsx format)Teacher instructionsAnswer Key included. *The topics covered are Normal distribution, RAND, NORMDIST, & INVNORM functions, as well as the absolute reference "$". The documents are Excel based, pdfs in
Subjects:
Grades:
9th - 12th
Types:
CCSS:
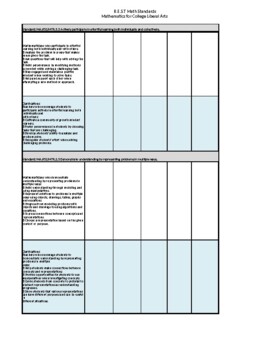
B.E.S.T. Math Standards Checklist for Math for College Statistics (FL)
B.E.S.T math standards checklist for Mathematics for College Statistics on an excel spreadsheet with 5 columns for data input. These standards are organized in their own sub-domains to coordinate lessons. Please see my free file for an example.
Subjects:
Grades:
9th - 12th
Types:
Also included in: All of the B.E.S.T. Math Standards Checklists K-12 (FL)
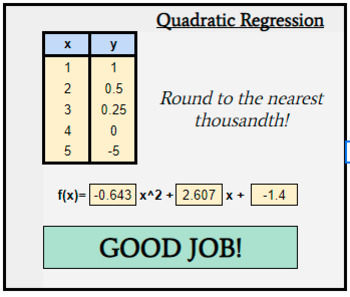
Quadratic Regression Equation Answer Checker
Google Sheets document which will check student answers without showing them the correct one. Perfect for embedding into your schools LMS, or for using in conjunction with my Domination Board Game (always FREE - see my store!).
Subjects:
Grades:
8th - 11th
Types:
Showing 1-24 of 53 results


