69 results
Free high school statistics resources for Google Apps
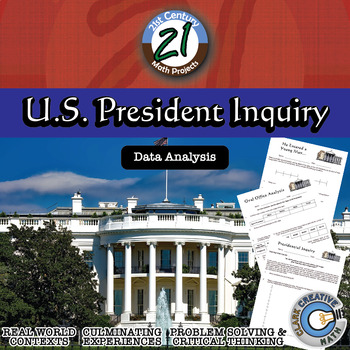
U.S. President -- Data Analysis & Statistics Inquiry - 21st Century Math Project
Engage students in data analysis through use of Presidential data in this 21st Century Math Project. Students will create box and whisker, stem and leaf, histograms and scatterplot through their investigations. In the end, students will take on the inquiry question: "Do US Presidents with the most children live longer after they have been inaugurated?" ***THIS PRODUCT HAS BEEN UPDATED WITH A GOOGLE SLIDES INTERACTIVE VERSION INCLUDED. REDOWNLOAD IF YOU HAVE IT ALREADY***-- In "He Entered a Youn
Subjects:
Grades:
6th - 12th
Types:
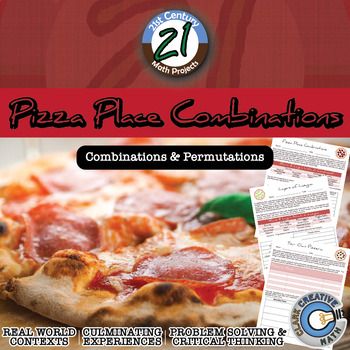
Pizza Place Combinations -- Combinations and Permutations - Math Projects
Pizza! Pizza! Mario & Luigi’s Pizzeria wants to make sure everyone knows that they are the best of the best. At their pizzeria, they allow customers to choose any number of toppings from their list to create pizzas and lasagnas. Join in on the fun with this 21st Century Math Project!In this 9 page PDF, you will be given a mapping to the Content Standards, an outline for how to implement the project, 3 different assignments for students to use, and an answer key. ***THIS PRODUCT HAS BEEN UPDA
Subjects:
Grades:
5th - 9th
Types:
CCSS:
Also included in: Probability & Expected Value Unit Bundle - Distance Learning Compatible
Measures of Center Escape Room Activity - Printable & Digital Game
Bring Escape the Room action into your math classroom while building conceptual understanding! This escape focuses on inequalities. Like all of my content, the math content is the focus and the extra sparks engagement. Will your students solve all of the clues in time? #escapeclasscceTo further amplify the excitement you can use the free the Escape Class HTML app (link included in PDF ) This will create interactive locks that your students must crack to move on. This application is also availabl
Subjects:
Grades:
6th - 11th
Types:
CCSS:
Also included in: Measures of Center & Variance Unit Bundle - Distance Learning Compatible
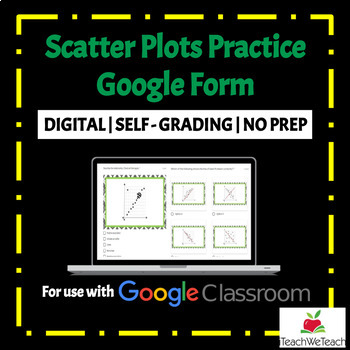
Scatter Plots | Google Forms Activity
★ DIGITAL Math Resource★ Are you looking for quality, standards aligned math resources to use with Google Classroom™? This resource is a fun and engaging way for students for practice solving problems involving scatter plots. This product includes a Google Form with 20 questions about scatter plots. Problems cover correlation type, the line of best fit and predicting scatter plot values. Possible Uses:• Practice• Homework • Assessment• ReteachCheck out my other products HERE.Please review my ter
Subjects:
Grades:
7th - 12th
Types:
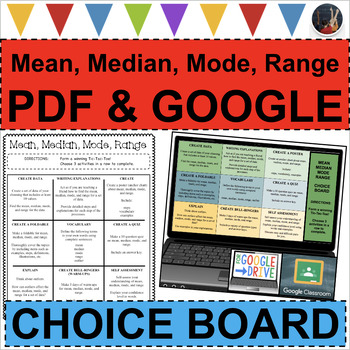
Mean Median Mode Range CHOICE BOARD Differentiated (PDF & GOOGLE SLIDES)
You will receive both the PDF and GOOGLE SLIDES versions of this resource to help meet your specific classroom needs (hybrid, in-person, virtual). You will access the GOOGLE version as a link on the first page of the PDF.MATH PRO - TicTacToe - Three in a RowAllow students to CHOOSE from a wide variety of engaging activities to complete. Research shows that allowing students to make their own choices can significantly increase motivation and aid in long-term retention of information. Even the m
Subjects:
Grades:
6th - 9th
Types:
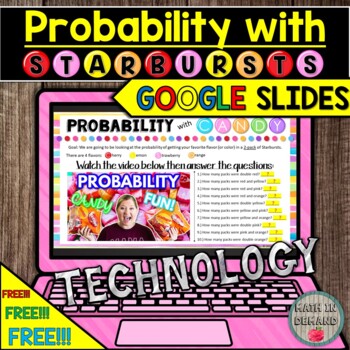
Probability with Starbursts Activity in Google Slides Distance Learning
This is a FREE GOOGLE SLIDES resource on the probability of obtaining your favorite flavor in a 2-pack of Starbursts. Students will watch a video that shows me unwrapping 74 Starbursts. They will calculate the probability of getting two red Starbursts, two orange Starbursts, and etc.You will be given a link that you can place in your Google Classroom. This resource is great because it involves NO PREP and has a video embedded in the resource.
Subjects:
Grades:
6th - 9th
Types:
Also included in: DIGITAL MIDDLE SCHOOL MATH GOOGLE SLIDES DISTANCE LEARNING RESOURCES
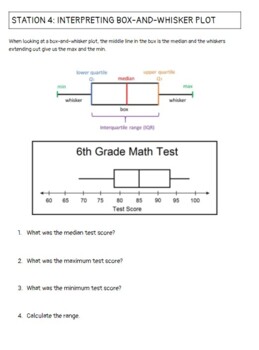
Applied Statistics End of Year Review Stations
A set of 10 stations to help students practice interpreting bar graphs, stem-and-leaf plots, and box-and-whisker plots. Also, works with finding the mean, median, mode, and range. Finally, have probability and normal distribution questions.
Subjects:
Grades:
7th - 12th
Types:
CCSS:
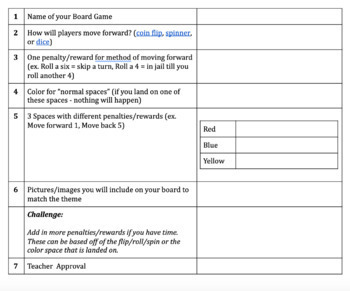
Board Game Probability Project
Students will create board games using JamBoard and explore using them together. They will discover different probabilities and compare their games to others. This is a fun student-centered project that can promote diversity through the different types of creations that students will make! The project is designed to last over 4 class periods but could be shortened or extended based on yours class!
Subjects:
Grades:
6th - 12th
Types:
CCSS:
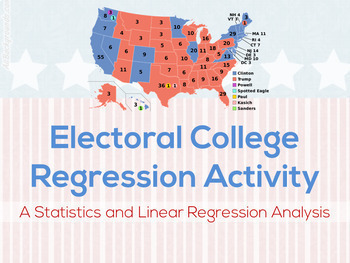
Electoral College Linear Regression Google Drive Activity
FREE HIGH SCHOOL MATH activity for the 1-1 classroom! Great cross-curricular activity for election day, inauguration day, etc.This Google Drive activity explores the relationship between state population and the number of electoral votes. Students will use linear regression within google sheets to come up with the regression equation and interpret the slope and y-intercept (also discovering every state is given two votes before adding extra votes based on population). Students will dig deeper
Subjects:
Grades:
8th - 12th
Types:
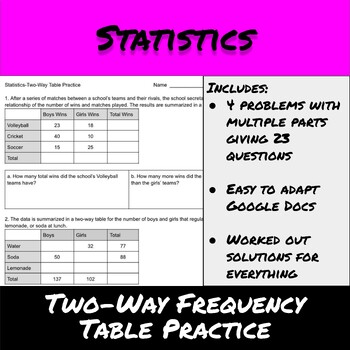
Statistics-Two-Way Frequency Table Practice
This is a review of skills on two-way tables. For this review students should be able to:Read and find values in a two-way frequency tableCreate a two-way table from data and from a storyThis worksheet contains 4 questions with multiple parts giving a total of 23 questions the students have to complete. All graphs are clear and easy to read.Questions too hard or too easy? These are provided as a Google Doc and set up so all questions are easy to adapt for the needs of your students.Want more?CL
Subjects:
Grades:
7th - 9th
Types:
CCSS:
Also included in: 8th Grade Math-Algebra and Pre-Algebra Whole Course Growing Bundle
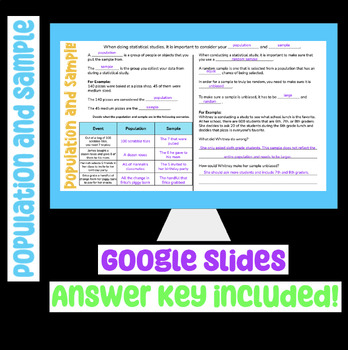
Population and Sample Google Slides Digital Notes
Try out an activity for free!Students learn how to identify the sample and population of a statistical study. Includes guided notes and practice problems where students identify the population and sample, and then use the sample to predict the outcome of the population. Would make a great introduction or review in any math classroom! Would make a great addition to a digital interactive notebook! Answer key included. Digital learning friendly!
Subjects:
Grades:
6th - 9th
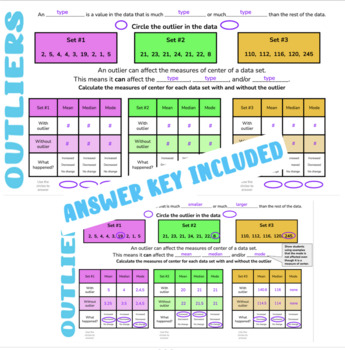
Outliers Google Slides
Try out an activity on me! Students learn how to identify an outlier is in a data set and what it does to the measures of center (mean, median, mode (shows no effect on mode). Includes guided notes and practice problems where students identify measures of center of data with and with and without the outlier. Would make a great introduction or review in any math classroom! Would make a great addition to a digital interactive notebook! Answer key included. Digital learning friendly!
Subjects:
Grades:
6th - 10th
First Day in AP Statistics
This is a FREE resource for AP Statistics teachers to use on one of the first days of the school year. This activity introduces the idea of running a simulation to perform inference, however, since it is the first day, it introduces no vocab or statistical methods, making it very accessible for students.This gives them a good taste of what sort of questions AP Statistics will set out to answer. Very hands on and great for the very first day!Check out my complete curriculum for AP Statistics here
Subjects:
Grades:
10th - 12th
Types:
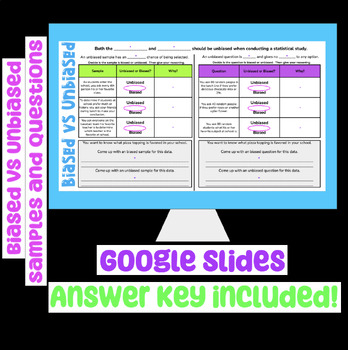
Biased vs Unbiased Samples and Questions Google Slides Digital Notes
Try out an activity for free!Students learn how to identify if a statistical sample and/or question is biased or unbiased. Includes guided notes and practice identifying biased and unbiased samples and questions. Would make a great introduction or review in any math classroom! Would make a great addition to a digital interactive notebook! Answer key included. Digital learning friendly!
Subjects:
Grades:
6th - 9th
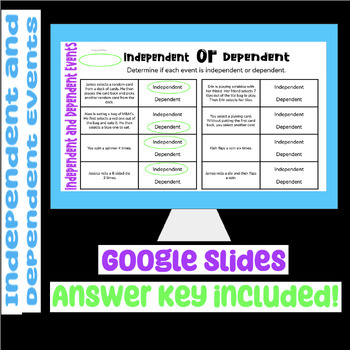
Independent and Dependent Events Google Slides Digital Notes
Try out an activity for free!Students learn how to identify independent and dependent events. Includes guided notes and practice problems where students identify if events are independent or dependent. Would make a great introduction or review in any math classroom! Would make a great addition to a digital interactive notebook! Answer key included. Digital learning friendly!
Subjects:
Grades:
6th - 9th
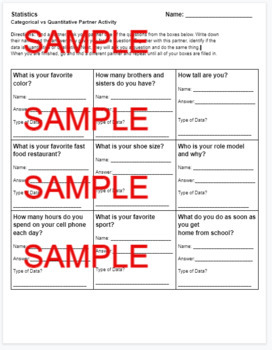
Quantitative vs Categorical Partner Activity
Middle School and High School Statistics Discussion ActivityHow can you describe the relationship between two variables and use it to make predictions?Student discovery and discussion on two major types of variables analyzed in statistics.Students will begin exploring and understanding data through the study of descriptive statistics. Students will learn to collect, properly display, analyze, and describe data.Directions: Find a partner. Ask your partner one of the questions from the boxes below
Subjects:
Grades:
7th - 12th, Higher Education
Types:
AP Statistics Syllabus | CED + The Practice of Statistics 6e Aligned
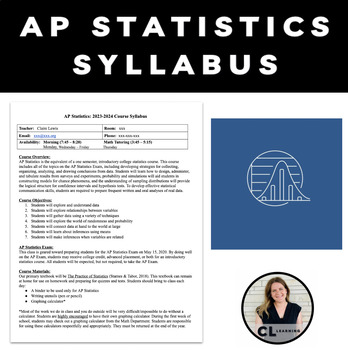
⭐⭐ Editable AP Statistics Class Syllabus & Student/Guardian Information sheet ⭐⭐This resource is aligned to The Practice of Statistics 6e textbook.Syllabus ComponentsWelcome LetterCourse OverviewCourse ObjectivesCourse MaterialsAP Classroom InformationGrade Make-UpMissing & Late Work PolicyAbsencesExtra CreditClassroom Expectations
Subjects:
Grades:
10th - 12th
Types:
TEACHING SAMPLING METHODS- A RIVER RUNS THROUGH IT ACTIVITY
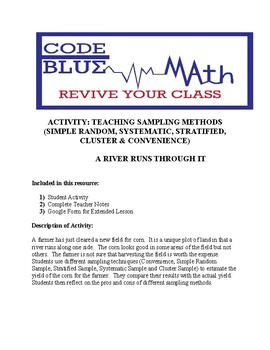
A farmer has just cleared a new field for corn. It is a unique plot of land in that a river runs along one side. The corn looks good in some areas of the field but not others. The farmer is not sure that harvesting the field is worth the expense. Students use different sampling techniques (Convenience, Simple Random Sample, Stratified Sample, Systematic Sample and Cluster Sample) to estimate the yield of the corn for the farmer. They compare their results with the actual yield. Students then ref
Subjects:
Grades:
11th - 12th, Higher Education
Types:
CCSS:
Statistics: Counting the Community Biblical Integration Lesson
Making authentic connections between Scripture and Math can be challenging. Biblical integration is not just displaying a Bible verse or reading from a devotional, but rather it is demonstrating the correlations between our subject matter and God's perfect design. Hopefully, these lessons will inspire amazing conversations and serve you and your students well.In This Lesson:Students will explore how statistics played a role in biblical times through the example of the census of Israel and discus
Subjects:
Grades:
9th - 12th
Types:

Comprehensive Statistics Worksheet Collection - 8 Units - 34 Worksheets
Enhance your statistics curriculum with this extensive collection of 34 worksheets spanning 8 units. Whether you're a math teacher looking for additional resources or a homeschooling parent seeking comprehensive materials, this worksheet collection provides a wealth of content to support students' understanding of statistics.Unit 1: Introduction to StatisticsWorksheets: 4Description: Introduce students to the fundamentals of statistics, including descriptive vs. inferential statistics, types of
Subjects:
Grades:
9th - 12th, Higher Education, Adult Education
AP Statistics, Full Curriculum, Relevant Topics, ALL FREE - Skew The Script
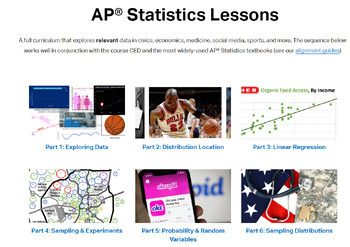
A free and full AP Statistics curriculum that explores relevant data in civics, economics, medicine, social media, sports, and more. The sequence works well in conjunction with the AP Stats CED and the most widely-used AP Statistics textbooks. Lesson resources include instructional videos, handouts, slide decks, answer keys, and Desmos activities. These flexible materials are perfect for traditional, flipped, or online classrooms. You can find it all (for free) right here: skewthescript.org/ap-s
Subjects:
Grades:
10th - 12th
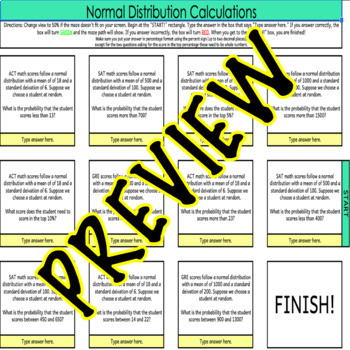
Normal Distribution Calculations
Normal Distribution Calculations Digital Maze is an activity where students can practice normal distribution calculations. Students will practice using Table A, Desmos, or Stapplet.com, to assist them in obtaining an answer.
Subjects:
Grades:
10th - 12th
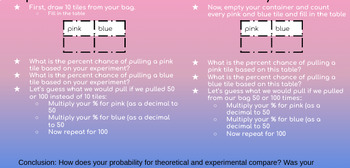
Experimental vs Theoretical Probability (FREE VERSION)
Here is a short little activity that I came up with to help students understand the Law of Large Numbers and the Difference between Experimental and Theoretical Probability. Cut out the pink and blue "tiles" or squares of paper/cardstock. I typically use 15 pink and 20 blue for this activity. The "pink" tiles are for cats and the "blue" tiles are for dogs.
Subjects:
Grades:
11th - 12th
Types:
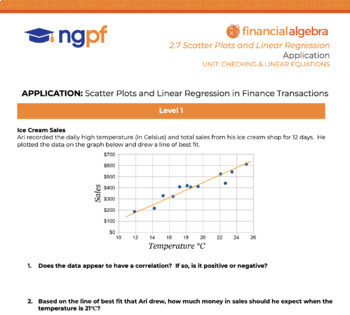
Scatter Plots and Linear Regression in Finance Transactions
Camilla used a check cashing service to cash checks of different values. A chart represents the number of transactions and the total fees that Camilla paid when she cashed her checks. Is the relationship linear? Students will find out by graphing a scatter plot by hand and then using Desmos calculator to do a linear regression. This three-tiered application problem set can be used to differentiate or scaffold the learning. Level 1 -- Interpret data on a scatter plot with line of best fit alread
Subjects:
Grades:
9th - 12th
Types:
CCSS:
Showing 1-24 of 69 results


