9 results
Free high school statistics interactive whiteboards
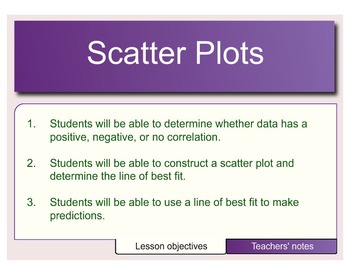
Scatter Plots
This lesson explores creating and analyzing scatter plots by determining the correlation: positive, negative, or no correlation. It also incorporates making predictions based on the line of best fit.
Negative Correlation, Data Display, Scatter Plot, Positive Correlation, Line of Best Fit, Best Fit Line, Correlation, No Correlation, Independent Variable, Dependent Variable
Subjects:
Grades:
7th - 9th
Types:
CCSS:
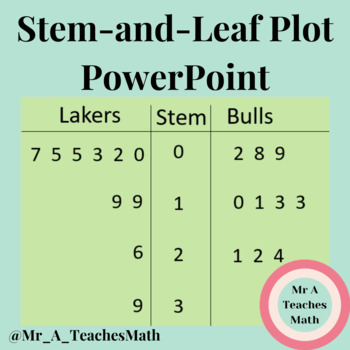
Stem-and-Leaf Plots
PowerPoint to support explanation and discussion of stem-and-leaf plots
Subjects:
Grades:
6th - 9th
SID.4 Calculating the Area Under the Normal Curve.
This lesson teaches students how to use the mean and standard deviation of a data set to create a normal curve and how to calulate the area (population percentage) under the normal curve given a range of values.
This lesson includes a SMART Notebook Presentation, guided notes with class work problems, and an answer key. The guided notes correspond with the SMART Notebook Presentation.
Subjects:
Grades:
9th - 12th
CCSS:

LOOK NO FURTHER, YOUR HIGHLY EFFECTIVE COMMON CORE LESSON IS HERE!
LOOK NO FURTHER, YOUR COMMON CORE HIGHLY EFFECTIVE ALIGNED LESSON IS HERE. NOT JUST AN ACTIVITY! REAL LIFE CAPTIVATING SCENARIOS.
-DOK QUESTIONING
-DIFFERENTIATION
-RUBRIC BASED ACTIVITY
-LITERACY VENTURE
-ASSESSMENT
In this bundle you will receive:
- Smart Notebook Slides
- Pamphlet
- Rubric Based Activity Task Card
- Teacher Manual
This lesson provides a range of questioning techniques meeting the criteria of the Common Core Standards. Aligned with these standards you will be provided with
Subjects:
Grades:
6th - 9th
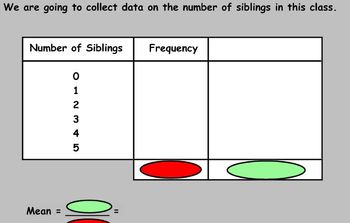
SmartNotebook Lesson - Calculating averages from a table
This notebook file can be used as an entire lesson to teach calculating averages from a table.
The first slide contains a starter asking students to find the mean, median and mode from sets of data. The second slide can be used to collect your own data in the class in order to show how to calculate the mean.
Following that there is another example, before finally showing two questions on the same slide which the students can work through.
Subjects:
Grades:
6th - 11th, Higher Education

Standardizing a Normal Distribution
This Smart Notebook introduces the concept of z-scores and standardizing.
Subjects:
Grades:
12th
Types:

Probability density function
This is a short teacher's guide to the resources illustrating probability density functions, available at mavisresources.com
These are free, online, animated resources for teaching advanced maths on the interactive whiteboard.
Subjects:
Grades:
10th - 12th
Showing 1-9 of 9 results


