408 results
High school statistics microsofts $5-10
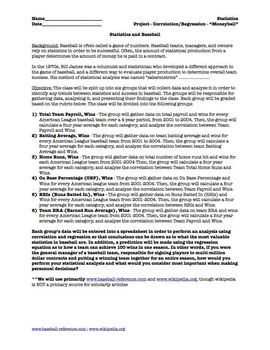
Statistics Correlation and Regression Project for Movie "Moneyball" (5 day)
Prerequisite: Correlation and Regression (Linear). This is a project that divides a statistics class into 6 groups and students do ACTUAL data collection from given websites and they perform their OWN ANALYSIS. They will use computers/internet/excel/spreadsheets/graphing calculators to evaluate correlation. If you have interest in baseball and statistics, this is a great project to get the class interested, and covers about 5 days, plus you can watch the movie "Moneyball" afterwards as a reward.
Subjects:
Grades:
10th - 12th, Higher Education, Adult Education
Types:
AP Biology Introduction to Statistics PowerPoint
The AP Biology* exam has been updated for the 2019-2020 school year. You can find the updated course description guide here. Make sure that you and your students are prepared for these changes. Save countless hours of research aligning your content to the new AP Biology* course outline by purchasing this resource. This resource includes everything your students need to know to master statistics related to AP Biology*.Included in this PowerPoint for the Introduction to Statistics in AP Biology* a
Subjects:
Grades:
9th - 12th
Types:
Also included in: AP Biology PowerPoints- FULL YEAR Bundle- Distance Learning Compatible
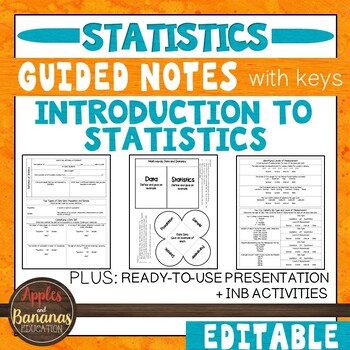
Introduction to Statistics - Guided Notes, Presentation, and INB Activities
This Introduction to Statistics product is flexible, editable, and can be used for in-person or distance learning. Take the time and stress out of creating your own guided notes and presentations. There are many ways to use this engaging bundle. It includes guided notes embedded with student practice problems (keys included), foldable activities, and a PowerPoint presentation for focused instruction. Choose what works best for your class/student and modify to make the content fit your needs. Not
Subjects:
Grades:
9th - 12th
CCSS:
Also included in: Custom Bundle for Viet
Chi Squared
Chi SquaredTeaching Chi Squared to a Stats class or AP Bio and not sure where to start?! Well, you found it. I created this product for my husband, who teaching AP Biology. This pack includes a PPT introduction, complete with student fill-in-the-blank notes, that walk students through the steps of Chi Squared and gives them a general overview of how and why we use this test. Degrees of Freedom are explained, as well as p-value. Notes provide an additional practice problem to do as a class. This
Subjects:
Grades:
9th - 12th
Probability - Tree Diagrams for independent and dependent events
To save you some time when you are preparing your lessons on dependent and independent events, I have collected a bunch of problems that can be solve by drawing tree diagrams and made a slide show of the questions and there answers. The tree diagrams are animated to enable you to explain as you go on. They can also be adjusted very easily and quickly to fit any other problems that you want you learners to solve.There are 6 examples of dependent events and 9 of independent events. I have also inc
Subjects:
Grades:
7th - 12th
12 Days of Christmas: A Computer Spreadsheet Activity
This great holiday activity shows students how to use a computer spreadsheet to calculate the cost of their true love's gifts in today's dollars.The simple step-by-step procedure will allow both beginning and computer-savvy students to experience success as they learn how to use spreadsheet software. Students will enjoy the engaging and entertaining activity. No computer? No problem! Use the activity master so students can calculate the costs themselves.
Grades:
5th - 9th
Types:
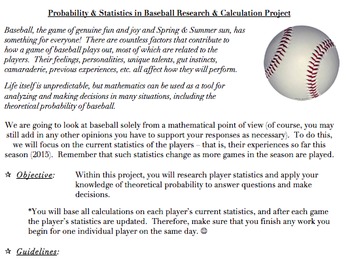
Probability & Statistics in Baseball Project (Common Core Aligned, AND FUN!)
The problems and activities within this document are designed to assist students in achieving the following standards: 6.SP.B.5, 7.SP.C, HSS.CP.A.2, HSS.CP.A.3, HSS.CP.B.7, HSS.CP.B.9, as well as the standards for mathematics practice and the literacy standards. They are also designed to help the teacher assess the students’ abilities when it comes to working with the ideas within the standards.This document contains the following:A project designed to allow students to investigate theoretical
Subjects:
Grades:
5th - 12th, Higher Education, Adult Education, Staff
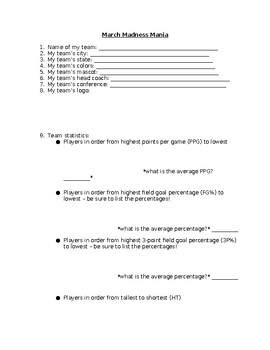
NCAA March Madness Basketball Tournament Team Research Statistics
Do you have students interested in the March Madness basketball tournament? Then this is the activity you need!To begin our March Madness unit, we look at all of the teams participating in the tournament and complete a map together to show where each team is from. We notice that some states have more than others and some states have none, and spend time discussing why that might be. Students will complete their own March Madness bracket.Students will then select a team in the NCAA March Madness
Grades:
4th - 9th
Types:
Cards Probability Scavenger Hunt Activity
A mix of 26 addition rule, multiplication rule, and conditional probability questions about a standard deck of cards. Find the cards in question to lead you to the next problem! This resource is a word document so you may edit it to your liking. I made this activity for my CP Probability&Statistics class - but it is also challenging enough for an AP level statistics class. It generally takes about two class periods - but my kids LOVE it and it is GOOD practice. The problems may be a little t
Subjects:
Grades:
9th - 12th, Higher Education
Types:

Scatter Plot and Bivariate Data Research Project
Students will begin a statistics project on one of their favorite restaurants or food chains! They will be researching nutrition facts and surveying others on what types of food they like to eat there. Through this data collection they will work on their skills of creating scatter plot graphs, creating relative frequency tables, and analyzing this data. This can be used either by paper or digitally. I used it the last two years during distance learning. Rubric included.
Subjects:
Grades:
7th - 12th
Types:
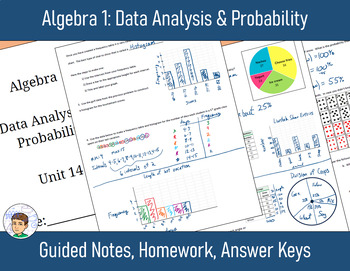
Algebra 1 Unit 14: Data Analysis & Probability - Notes, Homework, Answers
This unit is a great resource for any math course looking to add a supplementary unit on Data Analysis and Probability. You are buying guided notes, notes keys, homework assignments, and answers for a 6 lesson unit. This unit is based on a traditional Algebra 1 curriculum.Please check out the preview file to see what the unit will look like.This Word document makes it easy for you to modify, edit, or copy and paste to make your own reviews and tests for the unit.Topics covered in this unit are:R
Subjects:
Grades:
7th - 10th
Types:
Box and Whisker Plots for Special Education PRINT AND DIGITAL
This unit on Box and Whisker Plots has 100 pages and 30 slides of material specifically designed for students with special learning needs, especially autism who are in middle and high school. This unit focuses on helping students interpret and read box and whisker plots. There are differentiated versions of the worksheets that use pictures and color-coding. There are many opportunities for students to engage in repeated information on learning about what you can learn from box and whisker plo
Subjects:
Grades:
9th - 11th
AP Statistics Chapter 11 Notes PowerPoint and Guided Notes
Aligned with The Practice of Statistics (Sixth Edition); a presentation for the eleventh full chapter of AP Statistics (11.1 and 11.2 ), Testing Claims About Means. Includes: Tests About a Population Mean; and Tests About a Difference in Means. This file includes PowerPoint presentations for 11.1 and 11.2, along with their associated guided notes.This file is in PowerPoint format for the presentation and a PDF of the notes. If you prefer Google Drive, I have another file in my store that would b
Subjects:
Grades:
10th - 12th
CCSS:
Probability and Statistics March Madness Project
In this activity, students fill out a March Madness bracket by using the formula. Then, you will simulate each game to determine the winner. Then they fill out a March Madness bracket by selecting who you think will win. Let them do the research and discuss. It can be based on research of team and player statistics, the team name they like the most, the team mascot they like the most, or any other criteria they can think of! At the conclusion of the tournament, we will revisit this activity
Subjects:
Grades:
9th - 12th, Higher Education
Types:
Excel Projects for Statistics Frequency Distributions and Charts
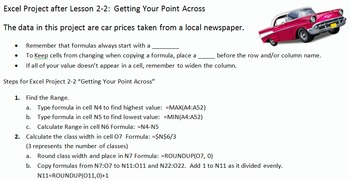
This file contains three different projects with solutions and a quick reference card for students. It correlates to Bluman's Elementary Statistics textbook.
First is an Introduction to Excel. There is an example, guided practice and then 4 Projects. The instructions are on each sheet. The topics covered are: basic editing and formatting, beginning charts, beginning formulas, such as SUM and AVERAGE, and calculations. There is an editable grading rubric for this project. The Preview file
Subjects:
Grades:
8th - 11th, Higher Education, Adult Education
Types:
High School Math IEP Goal Bank - Statistics and Probability
This IEP goal bank was created to assist special education teachers with the task of writing standards-based IEP goals in math. After spending countless hours developing IEP goals myself and really having to think through how to best individualize goals and objectives for my own students, I wanted to share this resource to help other special education teachers gain back some of their time.This goal bank includes the following:An introduction and guide that explains how to use the document.Each s
Subjects:
Grades:
9th - 12th
CCSS:
Statistics Survey project Discovery (broken down into sections) with Rubric
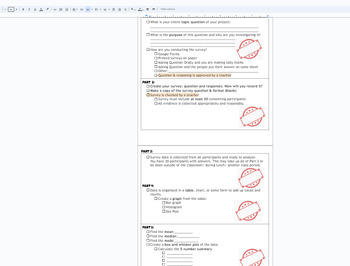
This is a broken down (scaffolded) packet of instructions/ guide for a Stats Project for Math 1 HS or 8th grade students. The goal of the project is for students to take a statistical survey on quantitative data (numbers) of their choice. Using this data from the survey, the following will be included in the project:Survey- the question being askedSurvey responses (requirement of 30)Data organization: Bar chart, Histogram, Dot PlotMeanMedianModeBox and Whisket Plot5 number summary (Q1,Q2,Q3, min
Subjects:
Grades:
7th - 12th, Higher Education, Adult Education
CCSS:
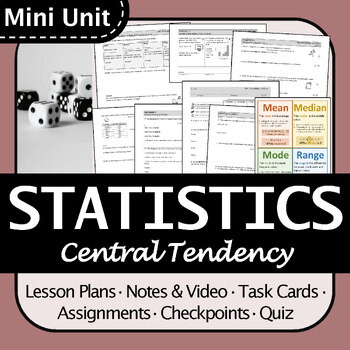
BC Math 8 Measures of Central Tendency Mini Unit, Engaging, Differentiated
This is an engaging mini unit that would work great for an in-depth look at measures of central tendency (mean, median, mode, and range) and how to choose them. The resources are well-organized and differentiated so they are accessible to a wide range of students.Students learn:How to calculate mean, median, mode, and range from a data set or frequency table.How to choose the best measure of central tendency (mean, median, or mode) given a particular situation or data set. Includes:Detailed les
Subjects:
Grades:
6th - 9th
Types:
Statistics, Topic 6: The Binomial Probability Distribution Lesson Plan
Welcome to a statistical journey like no other! Prepare to be captivated as we dive into the fascinating world of numbers, patterns, and probabilities in Topic 6: The Binomial Probability Distribution and Related Topics Lesson Plan. In this immersive lesson plan, spanning an exhilarating 116 slides, you'll embark on a thrilling adventure through animated visuals and thought-provoking problems. Get ready to unlock the secrets of data analysis, explore the depths of probability theory, and unravel
Subjects:
Grades:
11th - 12th
Also included in: Basic Statistics Year Long Lesson Plan Bundle
Statistics, Topic 9: Hypothesis Testing Lesson Plan
Welcome to a statistical journey like no other! Prepare to be captivated as we dive into the fascinating world of numbers, patterns, and probabilities in Topic 9: Hypothesis Testing Lesson Plan. In this immersive lesson plan, spanning an exhilarating 86 slides, you'll embark on a thrilling adventure through animated visuals and thought-provoking problems. Get ready to unlock the secrets of data analysis, explore the depths of probability theory, and unravel the mysteries of statistical inference
Subjects:
Grades:
11th - 12th
Also included in: Basic Statistics Year Long Lesson Plan Bundle

Statistics, Topic 8: Estimation Lesson Plan
Welcome to a statistical journey like no other! Prepare to be captivated as we dive into the fascinating world of numbers, patterns, and probabilities in Topic 8: Estimation Lesson Plan. In this immersive lesson plan, spanning an exhilarating 93 slides, you'll embark on a thrilling adventure through animated visuals and thought-provoking problems. Get ready to unlock the secrets of data analysis, explore the depths of probability theory, and unravel the mysteries of statistical inference. From b
Subjects:
Grades:
11th - 12th
Also included in: Basic Statistics Year Long Lesson Plan Bundle
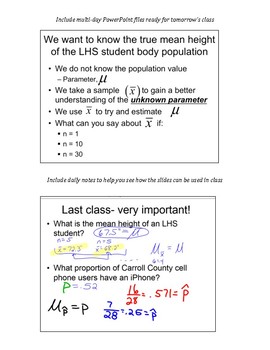
AP Statistics Stats Sampling Distributions Central Limit Theorem CLT tests keys
This is a large unit covering all things with sampling distributions. This includes three multi day powerpoint files, many handouts, two quizzes, a test (and answer keys).
The answer keys for handouts, tests and quizzes are included. I've also included my daily class notes so you can see how the powerpoint files can be used in class.
Subjects:
Grades:
10th - 12th, Higher Education
Statistics, Topic 4: Correlation and Regression Lesson Plan
Welcome to a statistical journey like no other! Prepare to be captivated as we dive into the fascinating world of numbers, patterns, and probabilities in Topic 4: Correlation and Regression. In this immersive lesson plan, spanning an exhilarating 99 slides, you'll embark on a thrilling adventure through animated visuals and thought-provoking problems. Get ready to unlock the secrets of data analysis, explore the depths of probability theory, and unravel the mysteries of statistical inference.
Subjects:
Grades:
11th - 12th
Also included in: Basic Statistics Year Long Lesson Plan Bundle
Statistics, Topic 7: Normal Curves and Sampling Distributions Lesson Plan
Welcome to a statistical journey like no other! Prepare to be captivated as we dive into the fascinating world of numbers, patterns, and probabilities in Topic 7: Normal Curves and Sampling Distributions Lesson Plan. In this immersive lesson plan, spanning an exhilarating 315 slides, you'll embark on a thrilling adventure through animated visuals and thought-provoking problems. Get ready to unlock the secrets of data analysis, explore the depths of probability theory, and unravel the mysterie
Subjects:
Grades:
11th - 12th
Also included in: Basic Statistics Year Long Lesson Plan Bundle
Showing 1-24 of 408 results


