31 results
High school statistics videos $5-10
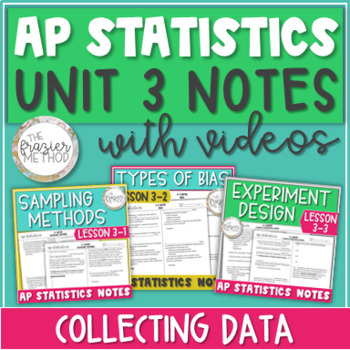
AP Statistics Notes & VIDEOS Bundle - Unit 3 Sampling Methods, Bias, Experiments
Through definitions, examples, & practice problems, use these AP Statistics NOTES WITH VIDEOS to help you teach or as an AP Statistics review of SAMPLING METHODS (3-1), TYPES OF BIAS (3-2), and OBSERVATIONAL STUDIES & EXPERIMENT DESIGN (3-3) whether you’re teaching in-person or distance learning! The screen-recorded videos of each lesson are perfect for absent students or as a substitute plan with no prep needed! Already taught through these topics this school year? Use these notes pages
Subjects:
Grades:
10th - 12th
Types:
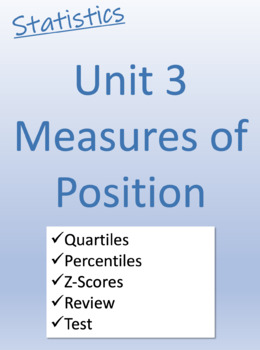
Statistics Unit 3--Measures of Position
Unit 3: Measures of Position3.1 Quartiles3.2 Percentiles3.3 Z-ScoresUnit 3 ReviewUnit 3 TestThis course is designed for a high school classroom. It's meant to be an informative and fun general statistics course covering:1. Descriptive Statistics2. Study Design3. Probability4. A selection of Inferential Statistics
Subjects:
Grades:
9th - 12th, Higher Education, Adult Education
Types:
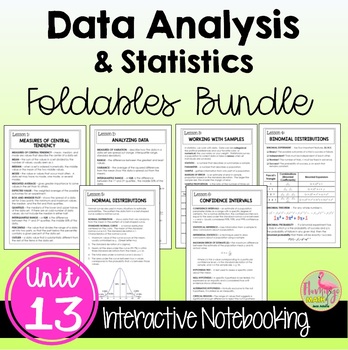
Data Analysis and Statistics FOLDABLES™ (Algebra 2 - Unit 13)
This bundle of 8-page Bound-Book-Style Foldables includes six lessons on topics in UNIT 13: Data Analysis & Statistics for your Algebra 2 Honors students. A set of finished notes and directions for creating the Foldables are also included.⭐ Bonus: A set of Google Slides for presenting the lesson and video lesson links are now included for distance learning and flipped classroom methods.☆FOLDABLESThree options of an 8-page Bound-Book Foldable® will help with differentiation.Option #1: All voc
Subjects:
Grades:
8th - 11th, Higher Education
CCSS:
Also included in: Algebra 2 Curriculum Big Bundle | Flamingo Math
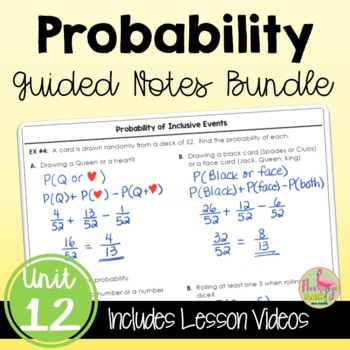
Probability Guided Notes (Algebra 2 - Unit 12)
Your Algebra 2 Honors students will have a set of Guided Student Notes plus Google Slides and a Warm-Up exercise with Video Lessons for each section to meet your flipped classroom or distance learning needs. There is also a complete solution set for lessons covering the topics and concepts for Probability. Teachers also have a fully-editable pacing guide with topics and standards for your planning needs.Guided Notes Format:The unit includes five lessons that will take approximately 15 instructio
Subjects:
Grades:
8th - 11th, Higher Education
Types:
CCSS:
Also included in: Algebra 2 Curriculum Big Bundle | Flamingo Math
Statistics : Permutations and Combinations Escape Room | Escape Classroom
**SEE THE PREVIEW AND FIND OUT FOR YOURSELF WHY WE ARE THE ORIGINAL AND THE #1 ESCAPE ROOM MATERIAL USED BY THOUSANDS OF TEACHERS AND SCHOOLS**INCLUDES:1) Escape Room Activity (internet required)2) Handout Material3) Lesson Plan On Subject4) Power Point Presentation5) Promotional Videos6) How-To Video7) Count Downs8) Test**The interactive nature of our videos set us apart from all other curriculum sources. Students LOVE our Super Villains, and will beg you for more. When was the last time your s
Subjects:
Grades:
9th - 12th
Types:
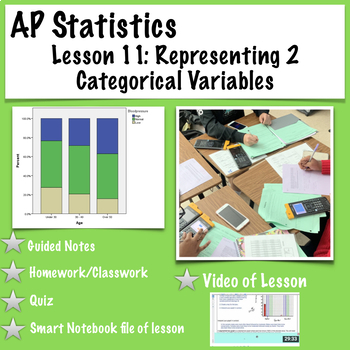
AP Statistics.Represent 2 Categorical Variables (with video of lesson)
Unit 2 Lesson 1 (11th lesson of the AP Statistics Curriculum)If you are interested in purchasing the whole curriculum, click on the links below.AP Statistics: Whole CurriculumAP Statistics: Whole Curriculum with videos of lessonsIncluded in this download:Guided NotesNotes for teacherLesson KeyVideo of lesson for flipped classrooms or absent studentsAssignment (Homework/Classwork)Lesson Quiz (key included)Power Point Presentation of lessonKeynote Presentation of LessonLink to supplemental materia
Subjects:
Grades:
9th - 12th, Higher Education
Types:
Also included in: AP Statistics Curriculum Mega Bundle (with videos of each lesson)
Intro to Statistics, first day activity
This activity is for 12th grade statistics class. Introducing stats requires some review of graphs and vocabulary, so this exercise is designed to do that. It begins on a Friday, they have homework over the weekend, and then we come back on Monday to discuss the results.Students will be able to collect data and put that data in a graphical form such that their peers will clearly understand what the information is telling us, as intended. This is among the first lessons in statistics for the sch
Subjects:
Grades:
11th - 12th
Types:
1:01:22
Video Tutorial for Excel
The tutorial covers the entire spectrum – from utilizing Excel for table and graph preparation to conducting statistical analyses using Anova tests, t-tests, or correlation methods. Students will not only master the technical aspects but also gain a deep understanding of how to interpret and derive meaningful insights from their data. This video is part of a 3 document bundle.
Subjects:
Grades:
9th - 12th
Also included in: Bundle - Help with Science Fair Table, Graphs, Statistics using Excel.

Statistics: Permutations & Combinations | Mystery Classroom (Distance Learning)
**WATCH THE PREVIEW VIDEO. FROM THE CREATORS OF THE ESCAPE CLASSROOM COMES THE MYSTERY CLASSROOM. WE HAVE JUST REDEFINED EDUCATION AGAIN WITH THIS NEW AND INNOVATIVE PRODUCT.**Includes:1) Mystery Activity (online)2) Handout Material3) Lesson Plan On Subject4) Power Point Presentation5) Promotional Video6) Count DownsTheatrical Mystery:This is a theatrical mystery. Students must answer questions based on specific curriculum in order to unlock the clues and obtain the testimonies. After they have
Subjects:
Grades:
9th - 12th
Types:
AP Statistics- Confidence Intervals for the difference in two proportions
A video of this lesson is included for flipped classrooms/absent students/teacher preparation. This lesson is available without the video in my store for $5.75. In this lesson students will: -Identify the shape,center, and spread of the sampling distribution of the dfference in two proportions -Determine if conditions are met for doing inference on the difference of two proportions -Construct and interpret a confidence interval for the difference of two proportionIn additi
Subjects:
Grades:
9th - 12th, Higher Education
Types:
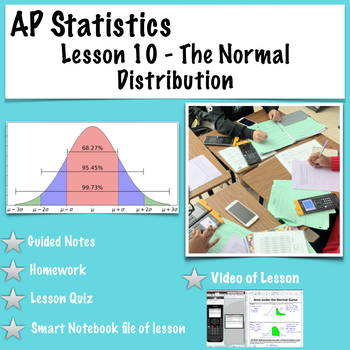
AP Statistics. Lesson 10-The Normal Distribution (with video of lesson)
Unit 1 Lesson 10 of the AP Statistics CurriculumIf you are interested in purchasing the whole curriculum, click on the links below.AP Statistics: Whole CurriculumAP Statistics: Whole Curriculum with videos of lessonsIncluded in this download:Guided NotesNotes for teacherLesson KeySMART notebook file of the guided notes to fill in with students2 Assignments (Homework/Classwork)Lesson Quiz (key included)Video of the lesson (you can purchase the lesson without the video at a lower price..visit my s
Subjects:
Grades:
9th - 12th, Higher Education
Types:
Also included in: AP Statistics Curriculum Mega Bundle (with videos of each lesson)
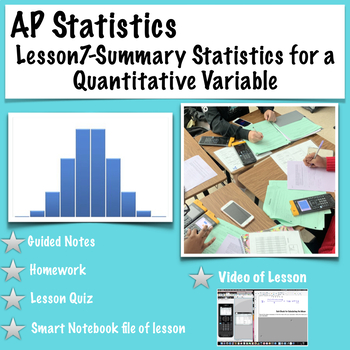
AP Statistics. Lesson 7-Summary Statistics for a Quantitative Variable (video)
Unit 1 Lesson 7 of the AP Statistics CurriculumIf you are interested in purchasing the whole curriculum, click on the links below.AP Statistics: Whole CurriculumAP Statistics: Whole Curriculum with videos of lessonsIncluded in this download:Guided NotesNotes for teacherLesson KeySMART notebook file of the guided notes to fill in with studentsAssignment (Homework/Classwork)Lesson Quiz (key included)Video of the lesson (you can purchase the lesson without the video at a lower price..visit my store
Subjects:
Grades:
9th - 12th, Higher Education
Types:
Also included in: AP Statistics Curriculum Mega Bundle (with videos of each lesson)
Intro to Statistical Graphs Mystery | The Mystery Classroom
**WATCH THE PREVIEW VIDEO. FROM THE CREATORS OF THE ESCAPE CLASSROOM COMES THE MYSTERY CLASSROOM. WE HAVE JUST REDEFINED EDUCATION AGAIN WITH THIS NEW AND INNOVATIVE PRODUCT.**INCLUDES:1) Mystery Activity (internet connection required)2) Handout Material3) Lesson Plan On Subject4) PowerPoint Presentation5) Interactive Videos6) Count Downs *Your students will have to figure out “who did it”. Students will engage with specific content in order to unlock multiple clues until they reach the testimon
Subjects:
Grades:
4th - 9th
Types:
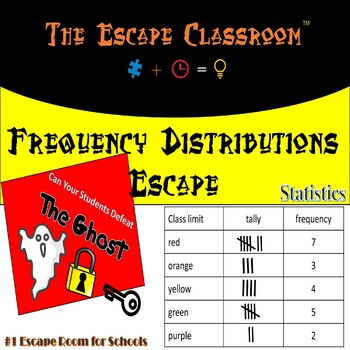
Statistics : Frequency Distributions Escape Room | Escape Classroom
**SEE THE PREVIEW AND FIND OUT FOR YOURSELF WHY WE ARE THE ORIGINAL AND THE #1 ESCAPE ROOM MATERIAL USED BY THOUSANDS OF TEACHERS AND SCHOOLS**INCLUDES:1) Escape Room Activity (internet required)2) Handout Material3) Lesson Plan On Subject4) Power Point Presentation5) Promotional Videos6) How-To Video7) Count Downs8) Test**The interactive nature of our videos set us apart from all other curriculum sources. Students LOVE our Super Villains, and will beg you for more. When was the last time your s
Subjects:
Grades:
9th - 12th
Types:
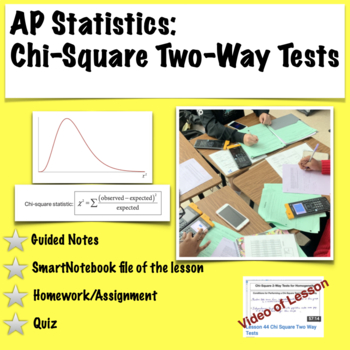
AP Statistics. Chi-Square Two-Way Tests (Independence and Homogeneity)
This product contains lesson 45 in Unit 8 of the AP Statistics Curriculum. (follows College Boards® new format).If you are interested in purchasing the whole curriculum, visit my store. I sell the whole curriculum with videos of the lessons and without videos. Included in this download:-Guided Notes-Lesson Key-SMART notebook file of lesson-Homework/Assignment-Quiz-Video of lessonIn this lesson students will: -State the hypotheses and calculate expected values for chi-square tests of i
Subjects:
Grades:
9th - 12th, Higher Education
Types:
Also included in: AP Statistics Curriculum Mega Bundle (with videos of each lesson)
21:42
Flipped Lecture - Ch19 One Proportion z-intervals
The following is part of flipped classroom for AP Statistics: One Proportion z-Intervals that completely explains the process and procedures and understandings required to successfully implement confidence intervals. While proportions are the parameter for this unit, many of the same ideas are used with One Sample t-Interval for Means.These videos are a complete lecture that is suitable to replace direct instruction in the classroom. The videos present statistics in an engaging and approachabl
Subjects:
Grades:
9th - 12th, Higher Education, Adult Education, Staff
22:21
Flipped Lecture - Ch23 One Sample t-Test for Means
The following is part of flipped classroom for AP Statistics: One Proportion z-Intervals that completely explains the process and procedures and understandings required to successfully implement hypothesis testing for one sample with means using p-Value and confidence intervals. The t-curve is explained in detail within this video. While means are the parameter for this unit, many of the same ideas are used with proportions.These videos are a complete lecture that is suitable to replace direct
Subjects:
Grades:
9th - 12th, Higher Education, Adult Education, Staff
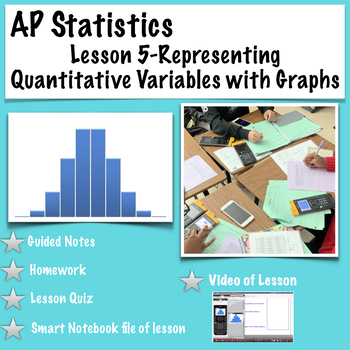
AP Statistics. Unit 1 lesson 5: Representing Quantitative Data (Video of lesson)
Unit 1 Lesson 5 of the AP Statistics CurriculumIf you are interested in purchasing the whole curriculum, click on the links below.AP Statistics: Whole CurriculumAP Statistics: Whole Curriculum with videos of lessonsIncluded in this download:Guided NotesNotes for teacherLesson KeySMART notebook file of the guided notes to fill in with studentsAssignment (Homework/Classwork)Lesson Quiz (key included)Video of the lesson (you can purchase the lesson without the video at a lower price..visit my store
Subjects:
Grades:
9th - 12th, Higher Education
Types:
Also included in: AP Statistics Curriculum Mega Bundle (with videos of each lesson)
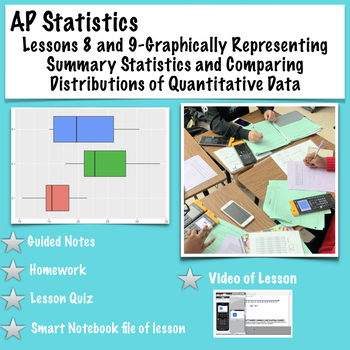
AP Statistics. Lessons 8/9Summary Statistics and Comparing Distributions w/video
Unit 1 Lesson 8 and 9 of the AP Statistics CurriculumIf you are interested in purchasing the whole curriculum, click on the links below.AP Statistics: Whole CurriculumAP Statistics: Whole Curriculum with videos of lessonsIncluded in this download:Guided NotesNotes for teacherLesson KeySMART notebook file of the guided notes to fill in with studentsAssignment (Homework/Classwork)Lesson Quiz (key included)Video of the lesson (you can purchase the lesson without the video at a lower price..visit my
Subjects:
Grades:
9th - 12th, Higher Education
Types:
Also included in: AP Statistics Curriculum Mega Bundle (with videos of each lesson)
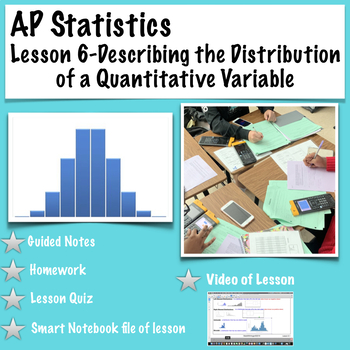
AP Statistics. Lesson 6-Describing the Distribution of a Quantitative Variable
Unit 1 Lesson 6 of the AP Statistics CurriculumIf you are interested in purchasing the whole curriculum, click on the links below.AP Statistics: Whole CurriculumAP Statistics: Whole Curriculum with videos of lessonsIncluded in this download:Guided NotesNotes for teacherLesson KeySMART notebook file of the guided notes to fill in with studentsAssignment (Homework/Classwork)Lesson Quiz (key included)Power Point Presentation of lessonKeynote Presentation of LessonLink to supplemental materialLink t
Subjects:
Grades:
9th - 12th, Higher Education
Types:
Also included in: AP Statistics Curriculum Mega Bundle (with videos of each lesson)
21:26
Flipped Lecture-Ch26 - Chi-Square Test(Goodness of Fit,Homogeniety,Independence)
The following is part of flipped classroom for AP Statistics: One Proportion z-Intervals that completely explains the process and procedures and understandings required to successfully complete an appropriate Chi Square Test. This also explains how to do calculations by hand and on the graphing calculator.These videos are a complete lecture that is suitable to replace direct instruction in the classroom. The videos present statistics in an engaging and approachable format. If you're looking to
Subjects:
Grades:
9th - 12th, Higher Education, Adult Education, Staff
16:20
Flipped Lecture-Ch21 Understanding Type I&II Error & Relationships w/i Inference
The following is part of flipped classroom for AP Statistics: One Proportion z-Intervals that completely explains the process and procedures and understandings required to pick the right features of a hypothesis test. This video goes into depth explaining the relationships between Type I and II errors and its relationship to the power of a test. It also discusses how to combine confidence intervals and hypothesis testing using p-value so that very strong evidence is presented in a conclusion.
Subjects:
Grades:
9th - 12th, Higher Education, Adult Education, Staff
29:16
Flipped Lecture - Ch 6-Part 1 Nearly Normal Conditions & Probabilities
The following is part of flipped classroom for AP Statistics Checking Nearly Normal Condition And Finding Probabilities Using The Bell Curve. Chapter 6 has two videos, of which this is the first part.These videos are a complete lecture that is suitable to replace direct instruction in the classroom. The videos present statistics in an engaging and approachable format. If you're looking to create a practical AP Statistics classroom to life, utilizing the flipped classroom will help you to do ju
Subjects:
Grades:
9th - 12th, Higher Education, Staff
Types:
20:56
Flipped Lecture-Chapter 5- Understanding and Comparing Distributions
The following is part of flipped classroom for AP Statistics Understanding and Comparing Distributions. These videos are a complete lecture that is suitable to replace direct instruction in the classroom. The videos present statistics in an engaging and approachable format. If you're looking to create a practical AP Statistics classroom to life, utilizing the flipped classroom will help you to do just that. There are a total of 25 videos in the package and the videos can be uploaded, modified,
Subjects:
Grades:
9th - 12th, Higher Education, Staff
Types:
Showing 1-24 of 31 results


