67 results
Free not grade specific statistics resources
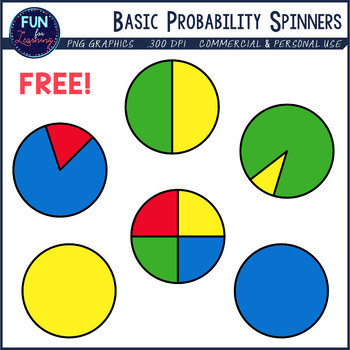
Statistics Clipart - PROBABILITY SPINNERS
FREE! There are 2 graphics for each of the following probability terms:
~ Certainly/ Impossible
~ Very Likely/ Very Unlikely
~ Equal Chance
______________________________________________________________________________________
This clipart collection includes a commercial use license that allows you to use these graphics to develop original digital download products to sell on TpT, Boom Learning, and similar online forums. For products that are intended to be printed, the graphics must be "l
Subjects:
Grades:
Not Grade Specific
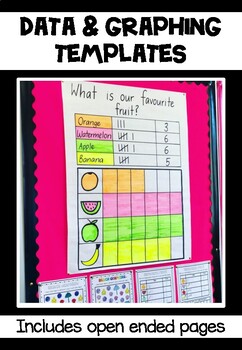
Graphing & Data Collection Templates
5 activities included: •Count/colour/graph the beach objects•Tally & graph favourite fruit• Would you rather donuts or cake? •Open ended graphing task where students can choose what to collect data about- either 'favourite ____' or 'would you rather ____ or _____'. American spelling versions are also included!
Subjects:
Grades:
Not Grade Specific
Types:
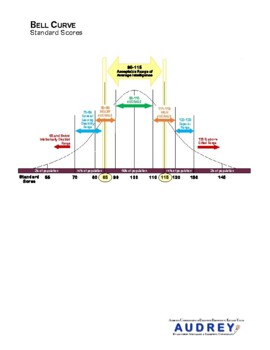
Special Education Evaluation Bell Curve SpEd Evaluation Diagnostician
Graphic to help explain standard scores to parents. See my other listings with the full version that contains information for parents.
Subjects:
Grades:
Not Grade Specific
Types:
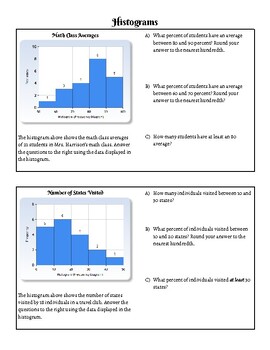
Histogram Practice Sheet
Aligned to the Algebra 1 NYS Next Gen Learning Standards- NY-6.SP4: Display quantitative data in plots on a number line, including dot plots, and histograms.This is a practice sheet to help students master histograms. Students will interpret the data from two histograms, and then construct their own histogram to represent a set of data. Designed to take about 20 minutes to complete
Subjects:
Grades:
Not Grade Specific
Types:
CCSS:
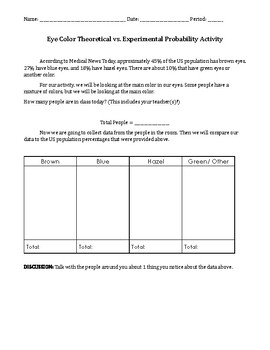
Theoretical vs. Experimental Probability Activity - PDF Version
FREE - Take it and modify it as you need!Quick and interactive activity for theoretical and experimental probability.Students will use theoretical data (historical data) and experimental data to determine the probability of selecting a person with a certain eye color.This can be done with a large group of students or as a class.Students will need to know:How to collect dataHow to calculate P(Events)Types of certaintyImpossible - 0%Unlikely - 0-50%Equal Chance - 50%Likely - 50-100%Certain - 100%
Subjects:
Grades:
Not Grade Specific
Types:
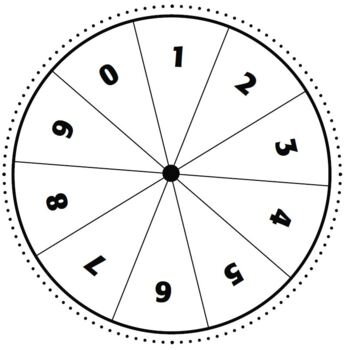
Spinners: 0 - 9
The PDF is 1 page long and has a set of 6 spinners divided into ten segments, numbered from 0 to 9.To use the spinner, place a paper clip in the centre - I've found it best to bend open one end to make a good pointer. Place a pencil's point through the looped side of the paper clip and on the centre dot of the spinner. Keeping the pencil in place with the finger of one hand, flick the paper clip with the other hand to spin around the pencil point. The paperclip will come to a stop over one of t
Subjects:
Grades:
Not Grade Specific
Types:
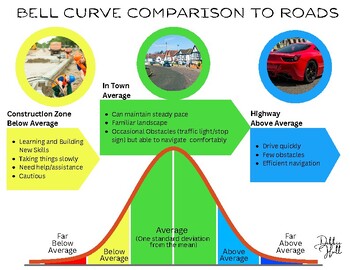
Bell Curve Comparison/Analogy to Roads
Embark on a journey of comprehension with this printable document, designed to demystify the complexities of standard curve data interpretation using a relatable road analogy. This image serves as a valuable resource for evaluation meetings, educational settings, or any scenario where understanding statistical distributions is paramount. You can use this image to explain standard scores to students, parents and staff. In the realm of driving, imagine your skill level as the journey on a road.
Grades:
Not Grade Specific
Types:
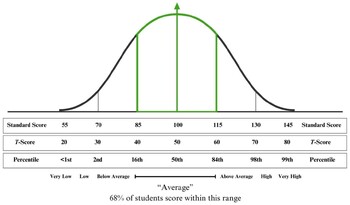
Bell Curve Diagram, Standard Scores, T-Scores, Percentiles
This bell curve diagram helps to illustrate standard scores, T-scores, percentiles, and qualitative descriptors. Print and bring to meetings to explain scores to team members, or include directly in your psychoeducational reports.
Subjects:
Grades:
Not Grade Specific
Types:
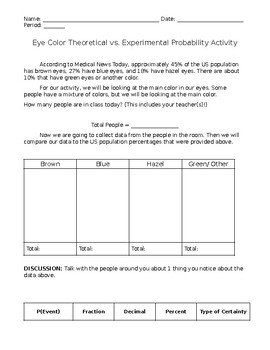
Theoretical vs. Experimental Probability Activity - Word Version
FREE - Take it and modify it as you need!Quick and interactive activity for theoretical and experimental probability.Students will use theoretical data (historical data) and experimental data to determine the probability of selecting a person with a certain eye color.This can be done with a large group of students or as a class. Students will need to know:How to collect dataHow to calculate P(Events)Types of certaintyImpossible - 0%Unlikely - 0-50%Equal Chance - 50%Likely - 50-100%Certain - 100%
Subjects:
Grades:
Not Grade Specific
Types:
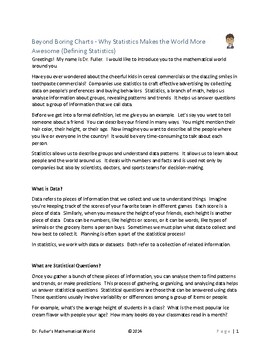
Beyond Boring Charts - Why Statistics Makes the World More Awesome (Script)
The script and pause points for the video Beyond Boring Charts - Why Statistics Makes the World More Awesome by MisplacedDecimal, LLC. This video is freely available on YouTube at: https://youtu.be/wWexz_o3Dcg
Subjects:
Grades:
Not Grade Specific
Types:
![Preview of STEM Poster, Manga Style, Math Expected Value (Digital format [JPEG], 12"x18")](https://ecdn.teacherspayteachers.com/thumbitem/STEM-Poster-Manga-Style-Math-Expected-Value-Digital-format-JPEG-12-x18--10922409-1705759177/original-10922409-1.jpg)
STEM Poster, Manga Style, Math Expected Value (Digital format [JPEG], 12"x18")
These are a set of colorful posters (12 total) which feature kids (teens) who are engaging in a hobby/interest of theirs and also includes a relevant mathematical or scientific equation (e.g. Construction and the Pythagoreon Theorem).This is to show that math/science is in everyday life even if in the background.This one is "Lucky". His hobby is gaming and his equation is the Expected Value equation used in probability and statistics.The best way to print these images is to go to your local prin
Subjects:
Grades:
Not Grade Specific
Types:
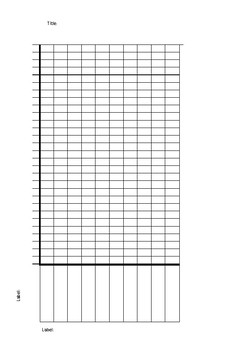
Bar Graph / Bar Chart Template
A simple template for creating bar graphs.
Includes spaces for labelling parts of the graph.
Printed to size, this will fit on one page of a standard Maths book.
Subjects:
Grades:
Not Grade Specific
Types:
![Preview of STEM Poster, Manga Style, Math Regression (Digital format [JPEG], 12"x18")](https://ecdn.teacherspayteachers.com/thumbitem/STEM-Poster-Manga-Style-Math-Regression-Digital-format-JPEG-12-x18--10922483-1705759898/original-10922483-1.jpg)
STEM Poster, Manga Style, Math Regression (Digital format [JPEG], 12"x18")
These are a set of colorful posters (12 total) which feature kids (teens) who are engaging in a hobby/interest of theirs and also includes a relevant mathematical or scientific equation (e.g. Construction and the Pythagoreon Theorem).This is to show that math/science is in everyday life even if in the background.This one is "Florence". Her hobby is chemistry and her equation is the Regression equation.The best way to print these images is to go to your local print shop, and have them print on 12
Subjects:
Grades:
Not Grade Specific
Types:
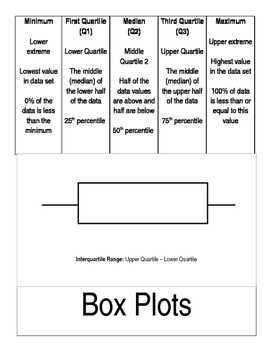
Box Plot Foldable
Foldable to teach the basics of a Box and Whisker Plot
Subjects:
Grades:
Not Grade Specific
attention Subs may not leave campus early
Sub announcement for sub folders. Highly recommend printing on colored paper.
Subjects:
Grades:
Not Grade Specific
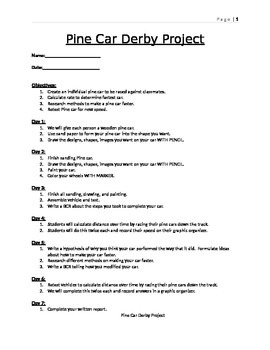
Pine Car Derby Project
The Pine Car Derby Project is a fantastic, 2 week lesson, we used when teaching 6th grade math. This lesson capitalizes on students kinesthetic and visual interests, using Pine Car, and teaching them about distance, speed average, hypothesis and the scientific method. Students build their cars, test them on the track, record data, modify their cars and retest. Students than answer short questions about the data collected and information learned. This lesson also contains a presentation in pr
Subjects:
Grades:
Not Grade Specific
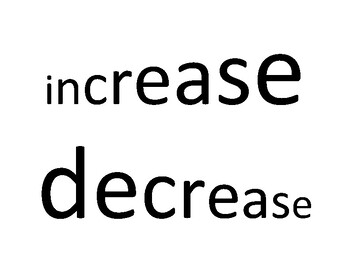
INCREASE vs DECREASE Poster
You can post this around your room to remind students that INCREASING is going from smaller to larger while DECREASING goes from largest to smallest. For example...What does increasing temperature mean? or List the levels of the ecosystem in decreasing order.
Subjects:
Grades:
Not Grade Specific
Types:
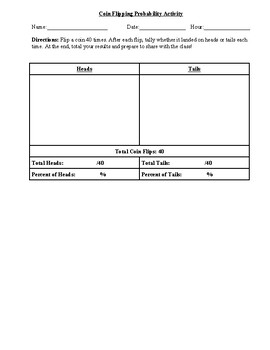
Coin Flipping Probability (Activity)
This activity allows students to do something kinesthetically in coin flipping while also practicing basic probability and statistics. This was originally designed to coincide with Mendelian genetics, but could easily be utilized elsewhere.
Subjects:
Grades:
Not Grade Specific
Types:
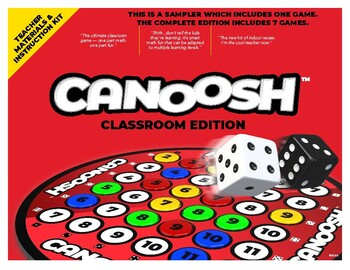
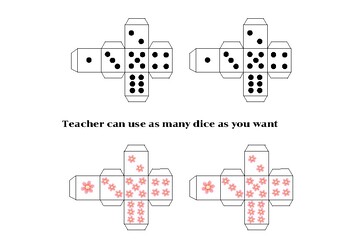
Canoosh Dice Probability Game (1-Game Sampler)
Canoosh is a collection of fast-action, easy-to-learn classroom dice games based on a simple two-dice probability chart. It was designed to be inclusive of any age/learning ability and integrates healthy competitive fun with a range of math learning concepts:Addition and subtractionFractionsProbability and statisticsStrategyCanoosh Classroom Edition is designed to be projected on a wall or chalkboard. You can use it with an entire class, divided into teams, in smaller group play, or as the new f
Subjects:
Grades:
Not Grade Specific
Types:
Personal Finance Game: Stock Market Simulator, Stradr.com
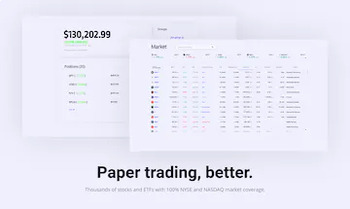
Stradr.comFree paper trading platform with education settings that hide user interaction, local groups for classroom competition, and global currency for all users, regardless of location. Also includes aftermarket trading, fractional shares, and the ability to start an account with as little as a cent of simulated money. Account resets also offered.
Subjects:
Grades:
Not Grade Specific
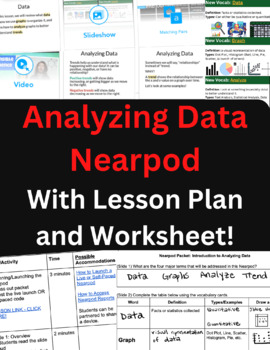
Analyzing Data Nearpod (Lesson Plan Included)
This Nearpod* activity is an introduction to analyzing data that works to either introduce the topic or review the key points. It starts by reviewing the two kinds of data (qualitative and quantitative) and common graphs (Line, Bar/Histogram, Dot Plots). Then it explores how to read a graph to see trends (positive/negative/no relationship) and gives students opportunities to practice reading graphs to identify whether there is a trend.What's Included:In addition to the Nearpod (9 slides), this d
Subjects:
Grades:
Not Grade Specific
Types:
NGSS:
MS-ETS1-3
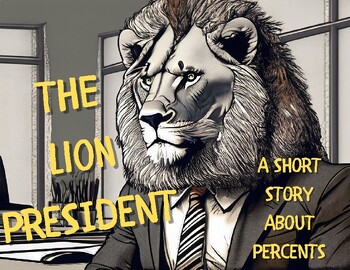
The Lion President- A Story about Percents/Percentages
I discovered recently that students of all ages respond very well to classic children's books with pictures. I decided to make my own to introduce our math percents unit with a practical example. Sure enough, my students loved it! I simply projected this and in my classroom and read through, which took about 10 minutes. Anyway, I thought I would share. All art was made with an AI generator.Please let me know if you enjoy!
Subjects:
Grades:
Not Grade Specific
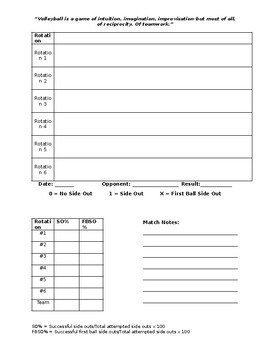
Volleyball Side Out Tracking Stat Sheet
Track your Side Out Percentage and First Ball Side Out Percentage with this detailed yet easy to use template. Includes rotation by rotation and whole team analysis.
Subjects:
Grades:
Not Grade Specific
Showing 1-24 of 67 results


