696 results
Free 12th grade statistics resources
U.S. President -- Data Analysis & Statistics Inquiry - 21st Century Math Project
Engage students in data analysis through use of Presidential data in this 21st Century Math Project. Students will create box and whisker, stem and leaf, histograms and scatterplot through their investigations. In the end, students will take on the inquiry question: "Do US Presidents with the most children live longer after they have been inaugurated?" ***THIS PRODUCT HAS BEEN UPDATED WITH A GOOGLE SLIDES INTERACTIVE VERSION INCLUDED. REDOWNLOAD IF YOU HAVE IT ALREADY***-- In "He Entered a Youn
Subjects:
Grades:
6th - 12th
Types:

Statistics Cell Phone Project with Rubric
This statistics project is extremely engaging because the students are required to collect relevant data pertaining to cell phone usage. Student will then be asked to analyze(Five Number Summary) and display the data in a myriad of formats (Frequency Histograms, Box-and-Whisker, Stem and Leaf, etc)
For the Excel file, please email me at E_Sigman@yahoo.com after purchase.
Subjects:
Grades:
7th - 12th
Types:
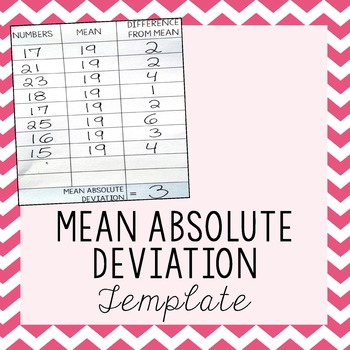
Mean Absolute Deviation Template
I created this template to help my students work through the steps of calculating Mean Absolute Deviation. The helped my students immensely and I hope it will help yours as well.I hope you will explore my other Mean Absolute Deviation products to help complete your unit:Mean Absolute Deviation MazeMean Absolute Deviation Activity with Zombies!Related Resourceso Click Here for more 8th Grade Math activitiesThis product is also part of the following money saving bundle:8th Grade Math Bundle - All
Subjects:
Grades:
6th - 12th
Types:
Also included in: 8th Grade Math Bundle ~ All My 8th Grade Math Products at 1 Low Price
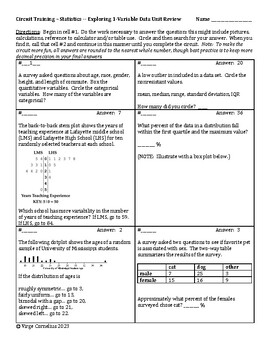
Circuit Training -- Statistics -- Exploring One-Variable Data
I wrote this circuit to help students review for a test on exploring 1-variable data. The topics closely align with Unit 1 from the Advanced Placement Statistics Course and Exam Description. Please read the directions carefully and work the circuit in advance of your students.Directions: Begin in cell #1. Do the work necessary to answer the question; this might include pictures, calculations, reference to calculator and/or table use. Circle and then search for your answer. When you find it, c
Subjects:
Grades:
10th - 12th, Higher Education
Types:
Scatter Plots | Google Forms Activity
★ DIGITAL Math Resource★ Are you looking for quality, standards aligned math resources to use with Google Classroom™? This resource is a fun and engaging way for students for practice solving problems involving scatter plots. This product includes a Google Form with 20 questions about scatter plots. Problems cover correlation type, the line of best fit and predicting scatter plot values. Possible Uses:• Practice• Homework • Assessment• ReteachCheck out my other products HERE.Please review my ter
Subjects:
Grades:
7th - 12th
Types:
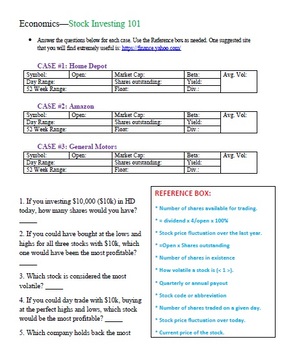
Stock Investing 101
For high school (and savvy middle school) economics students, Stock Investing 101 is a great tool for students to explore stocks on the Stock Market. This worksheet can be easily edited by simply changing the companies that the students need to investigate in order for it to be used over and over again. Estimated time for student completion: 45-60 minutes
Subjects:
Grades:
7th - 12th
Types:
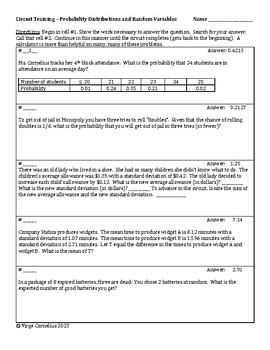
Circuit Training -- Probability Distributions and Random Variables
I wrote this set of 20 exercises to give my students more practice with the "bridge unit" (probability) between the basics of statistics and inference. A calculator is deifnitely required. Students begin in cell #1, work the problem, search for that answer and continue in this manner until the complete the circuit (get back to the beginning). This circuit is challenging! Let me know what you think! virge@virgecornelius.com
Subjects:
Grades:
10th - 12th, Higher Education
Types:
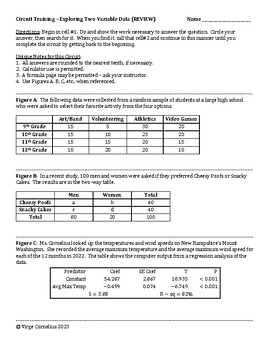
Circuit Training - Statistics - Exploring Two-Variable Data
I wrote this circuit as a review for the end of Unit 2 of the AP Statistics curriculum. It involves mainly linear regression but also some two-way tables. If you have never used a circuit before, I encourage you to read the directions carefully and work the entire set of exercises, in order, ahead of your students. The answers are imbedded in the circuit; it is how students will move from one question to the next. I am pretty sure there are no mistakes, but if you suspect an error, please em
Subjects:
Grades:
11th - 12th, Higher Education
Types:
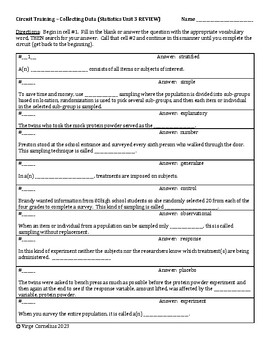
Circuit Training -- Collecting Data (REVIEW Unit 3 Statistics)
Statistics is heavy on vocabulary -- so this circuit helps students review those important words and phrases such as response bias, explanatory variable, randomization, matched pairs design and so much more. Download it, work it out before your students, and decide when it will be best to use to help them review vocabulary at the end of the unit on collecting data and experimental design.Would love your feedback!
Subjects:
Grades:
10th - 12th, Higher Education
Types:
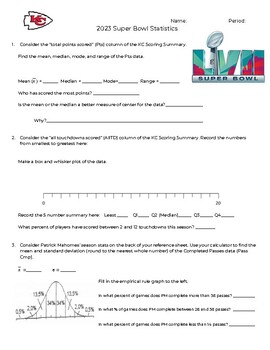
2023 Super Bowl Statistics Activity
This activity contains two stats sheets - one for the Philadelphia Eagles and one for the Kansas City Chiefs. Students are asked to use the data from the various tables to answer questions about the teams. This activity covers 1 variable statistics (mean, median, mode, range, standard deviation, box-and-whisker plot, histogram, two-way tables).This would be great as a partner activity or class activity.
Subjects:
Grades:
7th - 12th
Types:
CCSS:
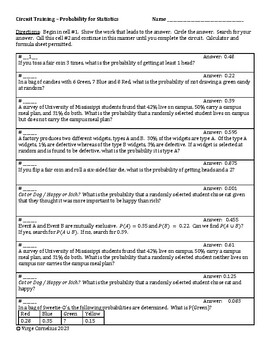
Circuit Training -- Probability for Statistics (Statistics)
I wrote this 20-question circuit to give students practice with the probability needed in statistics. The problems included are closely tied to the first half of AP Statistics Unit 4. A calculator is needed and students may use a formula sheet (or not) of their teacher's choosing. The answer key is not included because the answers are embedded in the circuit; it is how one moves from problem to problem in a scavenger-hunt fashion. Please do not post the answer key (if you make one) online wh
Subjects:
Grades:
10th - 12th, Higher Education
Types:
Silence the Violence -- International Data Analysis - 21st Century Math Project
Silence the Violence intends to take a closer look at gun violence throughout the world. Is there a correlation between gun ownership and gun violence? While this is on the news, and people argue back and forth, unfortunately there are not a lot of statistics cited.I built this project through the use of correlations of authentic international data. I have included content for either middle school (plotting and calculating) or high school (calculating correlation with summations). The results ar
Subjects:
Grades:
6th - 12th
Types:
CCSS:
AP Statistics Notes Intro to Probability Basic Probability & Complement Rule
AP Statistics notes on BASIC PROBABILITY & COMPLEMENT RULE for FREE!!! Define and calculate the probability of a single event, the probability of the event’s complement, and the probability assignment rule as it applies to sample space. Also included is the Law of Large Numbers.Aligns with AP College Board's objectives and standards for AP Statistics Unit 4: Probabilities, Random Variables, & Probability Models. WHAT’S INCLUDED IN THIS PRODUCT?Lesson 4-2: Probability Rules Part 1 – Intro
Subjects:
Grades:
10th - 12th
Also included in: AP Statistics Notes Unit 4 Bundle - Probability Rules & Random Variables
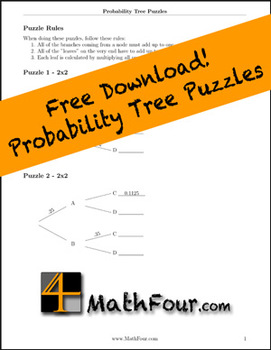
Probability Tree Puzzles
Using probability tree diagrams to teach probability is helpful - but sometimes kids need a little practice with them.
This worksheet has 11 probability tree diagrams to be "worked" as puzzles. This gives students practice filling them in and understanding the dynamics.
Once they have this practice, they can effectively use probability trees diagrams as tools.
Make sure you also download my Probability Trees Explained free "cheat sheet."
Subjects:
Grades:
8th - 12th, Higher Education
Types:
Statistics: Plots, Shapes of Distributions, Choosing Mean or Median
Statistics Integrated Review: Plots, Shapes of Distributions, and Statistics for Center and SpreadUse common data plots to determine shape of the data distribution, and choose appropriate statistics for center and spread. This product includes a one-page integrated review with a worksheet and answer key aligned with the common core. Students practice identifying the shape of a data distribution using common data plots (dot plot, histogram, and boxplot). Students also review how to choose appropr
Subjects:
Grades:
8th - 12th
Types:
CCSS:
Also included in: Bundle: Algebra 1 Statistics Unit Curriculum (Common Core)
AP Statistics Notes - Categorical and Quantitative Variables, Data Table, FREE
With definitions, examples, & practice problems, these AP Statistics notes will help you teach or review CATEGORICAL & QUANTITATIVE VARIABLES whether you’re teaching in-person or distance learning! Students will define data, context, cases, records, respondents, subjects, participants, experimental units, and variables. In addition to distinguishing between categorical, quantitative, and identifier variables, AP Statistics students will write a context sentence using the 5 W’s and identi
Subjects:
Grades:
9th - 12th
Types:
Probability Addition Rules Guided Notes (Mutually Exclusive and Overlapping)
Probability Addition Rules Guided Notes
This set of guided notes focuses on finding the probability mutually exclusive and overlapping events. All of the problems feature the key word "OR." For example, students might have to find the probability of choosing an ace or a spade from a standard deck of cards.
These fill in the blank notes include 3 examples and 5 practice problems. I have included the full size notes as well as the notes printed 2 to a page, which fits well in a spiral notebook
Subjects:
Grades:
6th - 12th
CCSS:
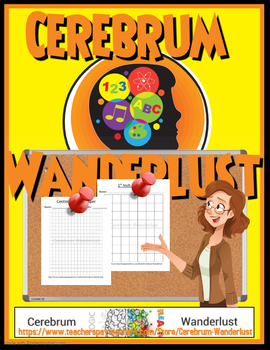
Centimeter & 1 Inch Grid Papers (Full Sheets Each)
A full sheet of Centimeter Grid Paper and a full sheet of 1 inch Grid Paper all contained in one easy to transport/store .pdf. You can use these sheets with making charts, plotting points, etc... Enjoy and thank you for your support.
Subjects:
Grades:
PreK - 12th, Higher Education, Adult Education, Staff
Types:
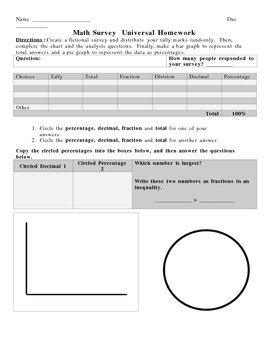
Take A Survey -- Learn Fractions, Percents and Decimals
This is a project that helps students learn to compute fractions, decimals and percents. The preview is a "universal" homework that students can complete for review any time during the year.
Take A Survey -- Learn Fractions, Percents and Decimals by Sherre Vernon is licensed under a Creative Commons Attribution-Share Alike 3.0 United States License.
Subjects:
Grades:
6th - 12th, Higher Education, Adult Education
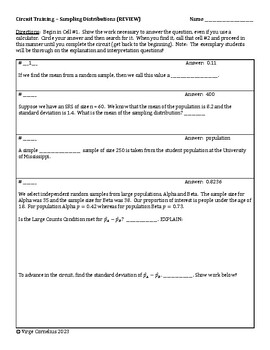
Circuit Training -- Sampling Distributions (Statistics)
Another Stats circuit! In this circuit, students will work with both proportions and means in preparation for inference (but no inference yet). This circuit hit on a lot of the topics from the AP Statistics CED Unit 5. 10% Condition, Central Limit Theorem, Large Counts Condition. Teachers should download the circuit and work it for themselves ahead of the students. The answers are embedded; it is how one moves to the next question in a self-checking, scavenger-hunt manner. If you do everyt
Subjects:
Grades:
11th - 12th, Higher Education
Types:
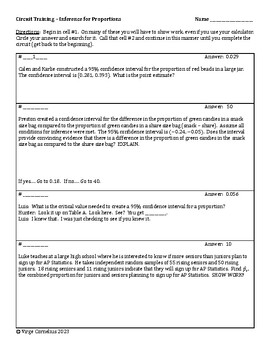
Circuit Training - Inference for Proportions (Statistics)
This 16-question circuit will give your students practice with confidence intervals and significance testing for proportions. The circuit format is self-checking so students know when they have made an error (can't find their answer and/or finish the circuit early). You will love the sound of your classroom when students are working on a circuit! On one of the questions students are asked to conduct a significance test and they will need seperate paper to do a good job on that!If I made edits
Subjects:
Grades:
11th - 12th, Higher Education
Types:
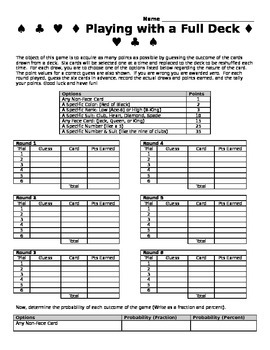
Probability Game - Playing with a Full Deck
This a fun game where students make predictions and then earn points if their predictions come true. They have to find the balance between choosing events that are not as likely and earning enough points to win. This document includes the probability calculations for each event so students can see why the points are assigned the way they are. This game is played as an entire class. One standard deck of playing cards is required.
Subjects:
Grades:
6th - 12th
Types:
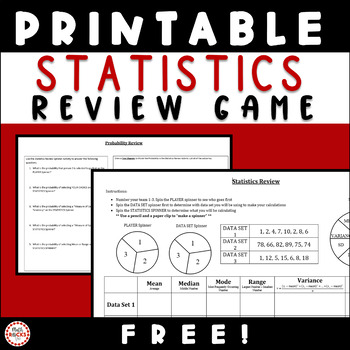
Statistics Review Activity FREEBIE| Mean Median Mode Variance Standard Deviation
Here is a fun way for your students to practice making statistical analysis calculations including mean, median, mode, variance, and standard deviation. INSTRUCTIONS:Use a paper clip and pencil as the spinner. Spin to determine which problem each student is responsible for solving. Mean, Median, Mode, Variance & Standard Deviation.Formulas are provided on the sheet. Page 2 - Probability extension - Drawing tree diagrams and answering theoretical probability questions based on the spinners.Pr
Subjects:
Grades:
10th - 12th
Types:
FREEBIE Probability Vocabulary and Formula Study Sheets (Common Core Aligned)
These probability study sheets provide a quick way for students to review essential vocabulary and formulas, including probability rules, as part of a high school probability unit. Probability Study Sheets include vocabulary and formulas on the following topics:Sample spaces; outcomes; events; two-way frequency table; conditional probability; union; intersection; complement; two-way frequency table; independent events; Venn diagrams; addition rule; complement; probability rules; complement rule;
Subjects:
Grades:
9th - 12th
Types:
CCSS:
Also included in: Bundle: Probability Unit Curriculum (Common Core)
Showing 1-24 of 696 results


