28 results
Common Core HSS-ID.C.9 projects
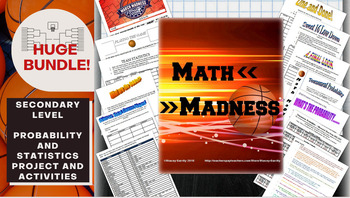
Math March Madness Full Tournament Project {BUNDLE}
Harness the excitement of NCAA March Madness with this huge project for secondary math teachers that follows all stages of the tournament! This Common Core aligned bundle comes with bonus parts not sold individually in my store so you can create a rich immersion in the tournament, practice probability and statistics and learn some interesting new ones along the way! Save $3 plus get bonus content by bundling!You can pick and choose which parts you would like to incorporate, or follow my schedu
Subjects:
Grades:
6th - 12th, Higher Education
Types:
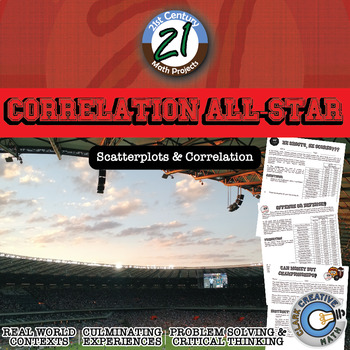
Correlation All-Star -- Sports Data Analysis - 21st Century Math Project
Bring an authentic sports-based math project to your Algebra, Algebra 2 or PreCalculus classroom with Lines of Best Fit and Correlations! All in this 21st Century Math Project! Using data from the MLB, NBA, NFL and NHL students investigate correlations to some of sports most common questions like: "Do more shots result in more goals?" "Do hitters or pitchers have more impact on a team's wins?""What NFL stat is most strongly correlated with wins?" and the grand-daddy..."Can money buy championship
Subjects:
Grades:
7th - 12th
Types:
CCSS:
High School Data Analysis Project
This project covers a large range of data analysis methods. There are eleven total parts to the project.
Part One: the students have to collect data from 20 students outside of the classroom. Directions specify to ask students from each grade level.
Part Two: Measures of Center and Variation. Students will calculate mean, median, mode, range, and standard deviation for some of the data collected. Definitions of each term are included.
Part Three: Box-And-Whisker Plot. Students will create t
Subjects:
Grades:
9th - 12th
Types:
CCSS:
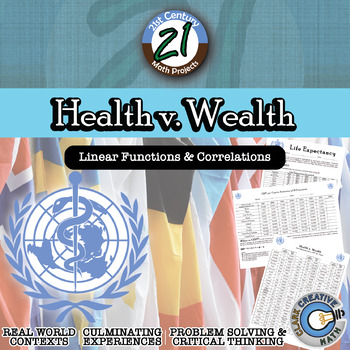
Health v. Wealth -- International Data & Correlation - 21st Century Math Project
Correlations and causation should be abundantly clear when students examine data of the Health and Wealth of over 80 nations around the world. The world is ever-changing and it is important for students to have a basic level of global awareness. In this 21st Century Math Project, students will use real world data to model regression functions, examine correlations and predict the future. In this project students will investigate global data sets to examine potential correlations related with the
Subjects:
Grades:
7th - 12th
Types:
CCSS:
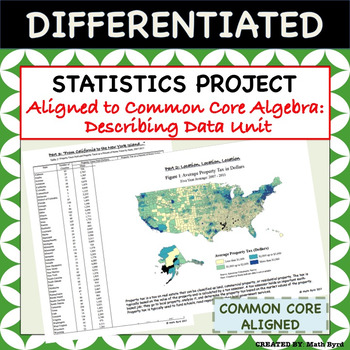
Statistics Project - Aligned to Common Core Algebra - Describing Data Unit
This differentiated U.S. Home Energy & Tax Themed Statistics Project covers all of the "describing data" standards of the Common Core Algebra Course using real data! Students will analyze various forms of tables & graphics to make inferences and interpret the data. The project is perfect for use as a summative assessment since students are required to justify their findings in open-ended format. Allow students to work in pairs, small groups, or individually! A grading rubric and selected
Subjects:
Grades:
8th - 11th
Types:
CCSS:
Also included in: Common Core Algebra 1 PROJECTS - BUNDLE PRICE!
AP Statistics
This AP Statistics curriculum bundle contains the following (please take time to preview video and/or individual item previews):Guided Notes and Graphic Organizers (EDITABLE)Exhibition stations (slides) with guided notes (EDITABLE)ActivitiesProjects (EDITABLE)Exams (EDITABLE)Teacher's pacing guide and suggested order for each unit Review in AP style for preparation for the APCOMING: powerpoint with guided notes for each of 9 units NEW! UNIT 1 and UNIT 2 slides and editable notes are currently in
Subjects:
Grades:
10th - 12th
CCSS:
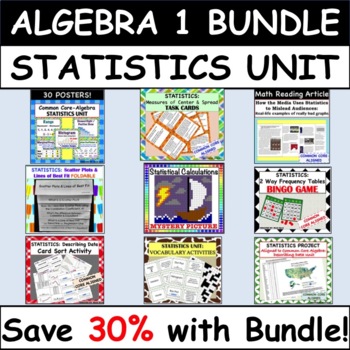
Common Core Algebra 1: STATISTICS UNIT - BUNDLE PRICE!
This Statistics Unit Bundle set includes a wide variety of 10 resources all geared towards the Common Core Algebra 1 course.Resources Included:Culminating Project Based on Real World Data30 PostersCard Sort ActivityMath Reading Article & Follow Up SummaryTask Cards ActivityFoldableMystery Color Picture Activity2 Vocabulary Activities including: Matching definition/vocabulary card set & crossword puzzleBingo GameLine of Best Fit - Class LabDifferentiation:Each resource in the bundle is di
Subjects:
Grades:
8th - 11th
Types:
CCSS:
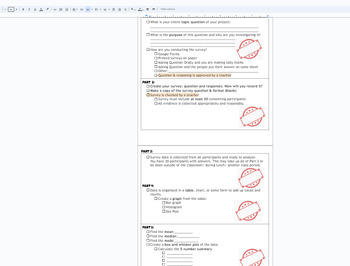
Statistics Survey project Discovery (broken down into sections) with Rubric
This is a broken down (scaffolded) packet of instructions/ guide for a Stats Project for Math 1 HS or 8th grade students. The goal of the project is for students to take a statistical survey on quantitative data (numbers) of their choice. Using this data from the survey, the following will be included in the project:Survey- the question being askedSurvey responses (requirement of 30)Data organization: Bar chart, Histogram, Dot PlotMeanMedianModeBox and Whisket Plot5 number summary (Q1,Q2,Q3, min
Subjects:
Grades:
7th - 12th, Higher Education, Adult Education
CCSS:
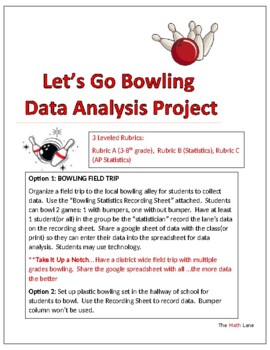
Let's Go Bowling Statistics STEM Project & Field Trip (3-12 and AP Stat)
Great END OF YEAR project. Get ready to strike up some fun with your students on a field trip to the bowling alley or right in your own hallway with a plastic bowling set! This isn't just any ordinary field trip - it's a real-world data collection extravaganza. 3 different leveled rubrics (Grade 4-10, Statistics, AP Statistics) so students can analyze the data based on their math knowledge. Students will be able to practice creating and analyzing graphical displays, scatterplots, construct c
Subjects:
Grades:
Not Grade Specific
Types:
Also included in: High School Statistics Project Bundle
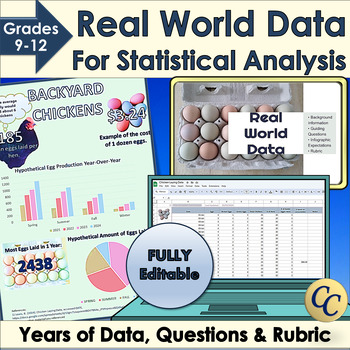
Real World Data for Statistical Analysis and Infographic Project
Give your students access to real world data for your statistical analysis unit or data literacy! Dive into statistics with Microsoft Excel™ or Google Sheets™ and years of data. Learn how to use standard deviation, mean or median to interpret data. Choose the best graphs to display conclusions in an infographic. Works great for science fairs! ✔ Includes an infographic project! (Template, expectations, and rubric). ✔ Everything is fully editable and you and your students can even use the images
Grades:
9th - 12th
Types:
CCSS:
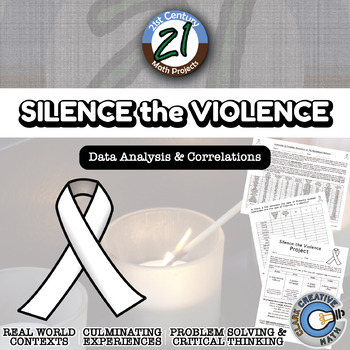
Silence the Violence -- International Data Analysis - 21st Century Math Project
Silence the Violence intends to take a closer look at gun violence throughout the world. Is there a correlation between gun ownership and gun violence? While this is on the news, and people argue back and forth, unfortunately there are not a lot of statistics cited.I built this project through the use of correlations of authentic international data. I have included content for either middle school (plotting and calculating) or high school (calculating correlation with summations). The results ar
Subjects:
Grades:
6th - 12th
Types:
CCSS:
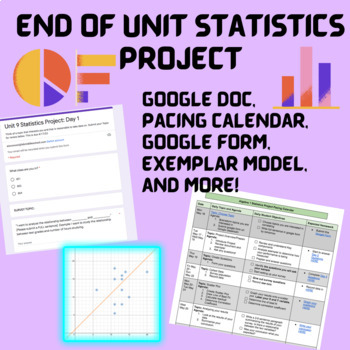
End of Unit Statistics Project- Collecting and Analyzing Data!
This is an amazing hands off project for your students to work on during their statistics unit. I often replace our end of unit test with this project, and make it a take-home assessment so they are doing most of the work for homework, but you could easily build it into your class periods! Students will be required to: come up with a survey topic determine population, sample, and questionsgather the data and turn it into a scatterplotdetermining the line of best fitresidualscorrelation coefficie
Subjects:
Grades:
6th - 12th
Types:

Journalism: Market Research Project Slideshow
Prepare your high school journalism students for the exciting world of media with our comprehensive "Market Research Project Slideshow." This 43-slide PowerPoint presentation is thoughtfully designed to guide students through the intricacies of market research, including data analysis, question, and focus generation, all tailored to the context of a high school newspaper.Key Features:Structured Learning: Our slideshow offers a systematic and well-structured approach to teaching market research,
Subjects:
Grades:
7th - 12th
CCSS:
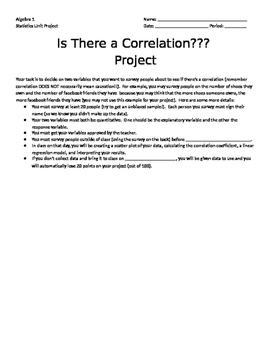
Correlation Project
This is a project I have done at the end of a Statistics unit in Algebra 1. Students survey at least 20 people with two quantitative questions and do a correlation study. The students make a scatter plot and find the line of best fit. Then, they find the linear regression and r value in a calculator and interpret them.
Subjects:
Grades:
9th - 11th
Types:
CCSS:
Investigate a COVID-19 Correlate using Linear Models of Real Data
Distance Learning: Investigate a COVID-19 Correlate using Linear Models with Real-World Data (Common Core) This Google™ Slides digital activity involves interpreting real US state health department surveillance data on COVID-19 as a member of a team of statisticians. Students will estimate a line of best fit using a scatterplot with county-level COVID-19 case rates and county-level age distributions. Next, students will interpret the model, evaluate the model fit using residuals, and identify re
Subjects:
Grades:
8th - 12th
Types:
CCSS:
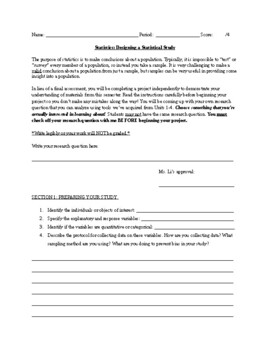
Statistics Project: Regressions + Designing a Statistical Study for High School
Hello!I've designed a statistics project that students in my class loved! This project requires students to go collect data on a topic that interests them. They have to design a sampling method that is as unbiased as possible. Students are then required to analyze their data and summary statistics. They also need to do a regression analysis on their study and make inferences using their results. This is perfect for a replacement of a test or as an end-of-semester project for students. Perfect fo
Subjects:
Grades:
9th - 12th, Higher Education
Types:
CCSS:
Also included in: AP Statistics / High School Statistics Projects
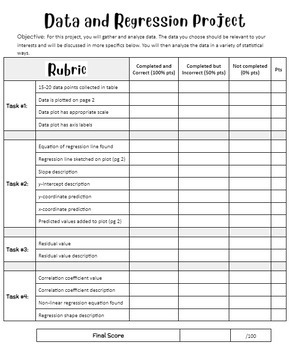
Data and Regression Project
Sample includes directions. Actual product includes directions, rubric, and student worksheet. In this project students will generate a data set of two potentially correlated variables. They will then analyze this data with regression equations, residuals, and correlation coefficients. This is a great project to get to know what interests your students and a good chance for student collaboration. A great chance for PBL in the math classroom as well.
Subjects:
Grades:
9th - 12th
Types:
CCSS:
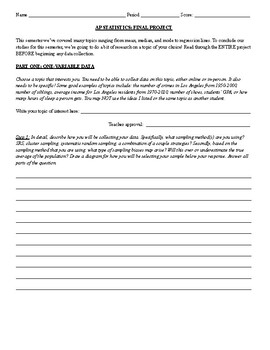
AP Statistics Project: Normal Distributions, Regression Analysis, and Sampling
If you are looking for a cumulative project that summarizes the three topics relating to: one-variable data analysis, two-variable data analysis, and sampling methods, this is a great project to provide to your regular or AP Statistics students. Topics covered in this project include normal distributions, scatterplots, correlation, regression analysis, sampling methods, sampling biases, and statistical thinking. It covers Unit 1, Unit 2, and Unit 3 materials in the AP Statistics suggested course
Subjects:
Grades:
11th - 12th
Types:
CCSS:
Also included in: AP Statistics / High School Statistics Projects
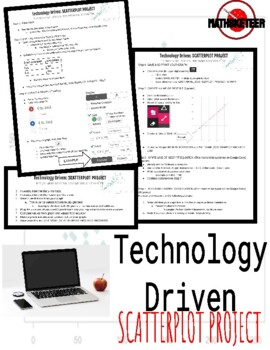
Technology Driven: Scatter Plot Project
This is a TECHNOLOGY DRIVEN project worth 100 points.The following (free) technologies are required:-Google Docs-Kami (Annotating Software)-Desmos (Graphing Software)All Software is available through any Internet Browser.The project features detailed step by step student instructions and examples (with pictures for those not familiar with the software).Project Breakdown:-Research on correlated items (i.e. fat content and calories)-Table Creation-Graphing Points-Line of Best Fit-Conceptual Unders
Subjects:
Grades:
8th - 11th
Types:
CCSS:
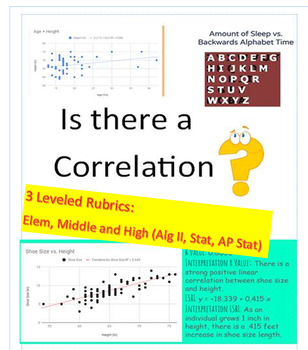
Correlation? Data Project (3 Rubrics_Elem/Middle School/ AP Stats) EOY
Get ready to supercharge your students' data analysis skills with this dynamic project! Perfect for end of year or semester project. In this engaging activity, students will have the exciting opportunity to collect their own data through surveys, online research, or real world data sets. They will then dive deep into the world of statistics as they determine if there is a correlation between two variables. With three different leveled rubrics, this project is perfect for students of all ages an
Subjects:
Grades:
Not Grade Specific
Types:
CCSS:
Also included in: High School Math Projects (Algebra II and Statistics) STEM No prep
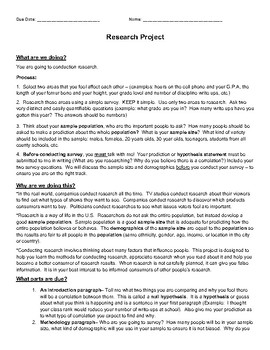
Statistical Research Project and Paper - Let Students Choose the Topic
We know that reading and writing are important skills for any discipline or career. Bring some real-world research experience to your advanced 8th grade classroom or high school math class by teaching them how to apply statistics. Students will have choice in determining the topic of their research project and students may work individually or in small groups to complete the assignment. Through real world application of statistics students will gain valuable experience with writing and readin
Subjects:
Grades:
8th - 11th
Types:
CCSS:

Teaching with Baseball Statistics
I use this activity to teach my science students how to model an idea using data. Students learn to predict the outcomes of a baseball pitcher based on their last 3 years of stats. Students learn to analyze their data and determine trends in the data. Students also learn to compare data from their pitcher to other students' pitchers (collaboration). Students also must be able to/learn to accurately graph their data. There is also a research component as students must research their pitcher's
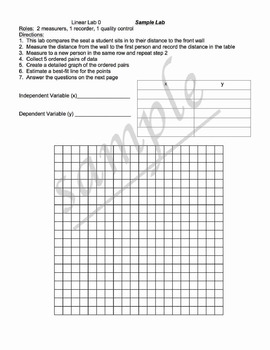
Linear Relationship Labs
This project has 1 sample lab to complete together as a class and 6 other labs that create a linear relationship.
Students work through the labs collecting data and then analyze the data to create equations, use calculators or spreadsheets to create regression equations (best fit lines), and use the equations to make predictions.
classes: algebra 1, geometry, algebra 2, applied math
Here are links to my other algebra projects:
Click Here to see my project: Systems of Equations - Comparing Ph
Subjects:
Grades:
7th - 12th, Higher Education, Adult Education
Types:
CCSS:
Scatterplots Statistics Project Group Presentation Experiment
This project requires students to determine a hypothesis, collect data, make a scatterplot, and analyze the scatterplot for an correlations. Then, students will make predictions, determine if their hypothesis was correct, and present their findings to the class. This project can be used as an independent assignment or as a group project. It can be added to Canvas as a Google Assignment. The project comes with an already made rubric.
Subjects:
Grades:
6th - 12th
CCSS:
Showing 1-24 of 28 results

