13 results
Common Core HSS-ID.C.9 graphic organizers
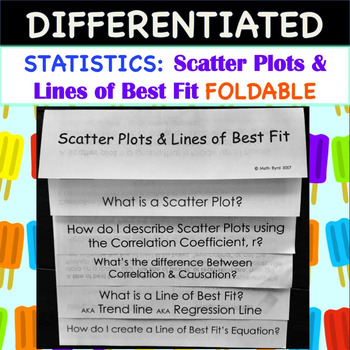
Statistics:Scatter Plots and Lines of Best Fit FOLDABLE
So Easy to Use! Simply print and fold! No need to rotate pages! Scatter Plots and Lines of Best Fit FOLDABLE also includes a PowerPoint to go along with the foldable.Foldable has 2 tiers of differentiation, perfect for the inclusive classroom! 1 set has fill-in-the-blank style notes within the foldable, while the other foldable has the notes already filled in. On both sets, students will have to work out the examples.Students will learn how to: Create Scatter PlotsDescribe Scatter Plots using Co
Subjects:
Grades:
8th - 11th
CCSS:
Also included in: Common Core Algebra 1: STATISTICS UNIT - BUNDLE PRICE!
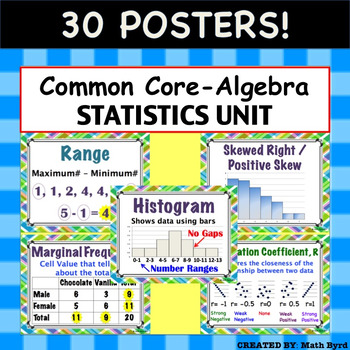
Common Core Algebra - Statistics Unit: Describing Data POSTERS
30 Posters! Each 8.5" x 11" in size. Posters are aligned with Common Core's Algebra - Statistics: Describing Data Unit. Posters Included:MeanMedianModeRangeInterquartile RangeOutlierMean Absolute DeviationMeasures of CenterMeasures of SpreadDot PlotHistogramBox PlotNormal/ Bell Shaped DistributionSkewed Right/Positive SkewSkewed Left/ Negative SkewUniform2 Way Frequency TableJoint FrequencyMarginal Frequency2 Way Relative Frequency TableConditional Relative FrequencyScatter PlotCorrelationCorrel
Subjects:
Grades:
8th - 11th
CCSS:
Also included in: Common Core Algebra 1 POSTERS - BUNDLE PRICE!
AP Statistics
This AP Statistics curriculum bundle contains the following (please take time to preview video and/or individual item previews):Guided Notes and Graphic Organizers (EDITABLE)Exhibition stations (slides) with guided notes (EDITABLE)ActivitiesProjects (EDITABLE)Exams (EDITABLE)Teacher's pacing guide and suggested order for each unit Review in AP style for preparation for the APCOMING: powerpoint with guided notes for each of 9 units NEW! UNIT 1 and UNIT 2 slides and editable notes are currently in
Subjects:
Grades:
10th - 12th
CCSS:
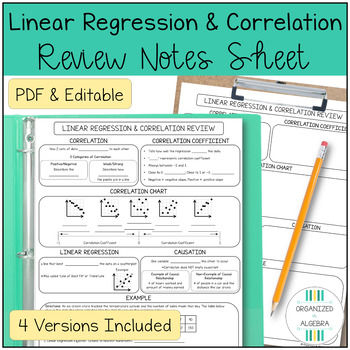
Linear Regression Correlation Review Notes Sheet Algebra 1 Test Prep
Looking for a review of Linear Regression and Correlation that meets the needs of all your students, without the time commitment of differentiating?This no-prep, differentiated Algebra 1 Review Sheet is perfect to get your students ready for an end of chapter or end of year test in Algebra (including the NYS Algebra 1 Regents exam)!Includes 4 versions (Reference Sheet, Filled In Notes, Guided Notes & Graphic Organizer) and comes as a no prep, printable PDF AND an editable PowerPoint !Topics
Subjects:
Grades:
9th - 11th
CCSS:
Open Up Algebra 1: EOY One Page Chapter Reviews
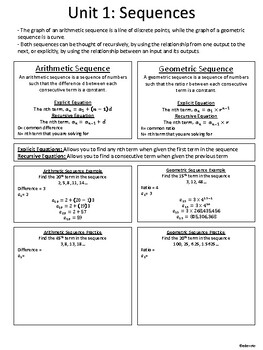
End of Year One Pager reviews for each chapter in Illustrative Math Algebra 1 Open Up Curriculum. Reviews include practice problems for students and act as a study guide to save for future lessons or final exams.
Subjects:
Grades:
7th - 10th
CCSS:
Algebra 1 Big Ideas Chapter 4 Lesson Notes and KEYS
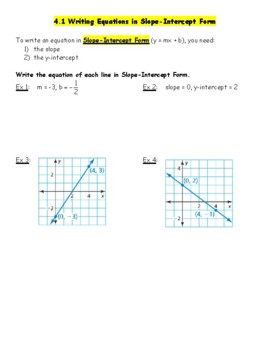
The vocabulary, key concepts, images, diagrams, problem directions, and problems are all set up. You just work through the examples with your students. Students can also print these notes outlines before coming to school each day, so they don't have to rush to copy down all of the above, but instead focus on working through the concepts. Answer Keys also provided.
Grades:
8th - 12th
CCSS:
Types of Correlations of Scatter Plots Graphic Organizer | Algebra 1 Notes
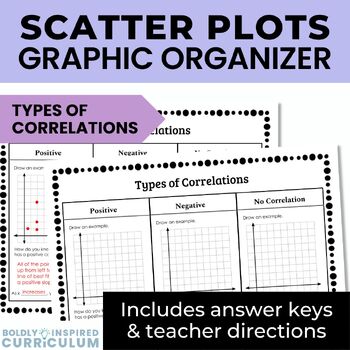
Supplement your scatter plots guided notes with this types of correlations graphic organizer. This resource compares positive, negative, and no correlation with graphs and example problems.Your students will draw examples of each correlation, then explain how they know their answer is correct. They will also explain how x relates to y on their graph.Graphic organizers are perfect for creating reference sheets that your students can use throughout the year! When completed, they are easy to read a
Grades:
7th - 8th
Types:
CCSS:
Describing Scatter Plots Graphic Organizer and Info Sheet: AP Statistics
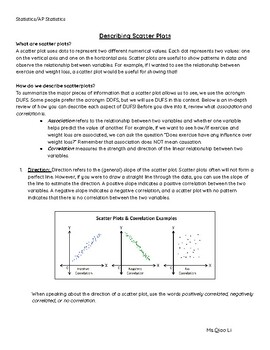
If your students are struggling with describing the different aspects of scatter plots (direction, form, strength, etc.) this graphic organizer is a good resource to help your students write their responses. This can be used in an AP Statistics class or an elementary statistics course. It includes detailed information about each part of describing a scatter plot, a graphic organizer to help students write their own responses, and an example.
Subjects:
Grades:
9th - 12th, Higher Education
CCSS:
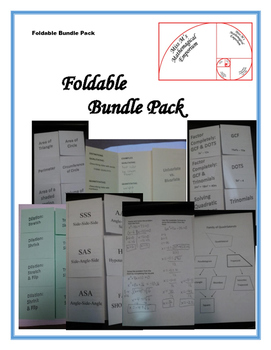
Foldables Bundle Pack
**Please read the instructions included to be able to print this product correctly!**
Seven different foldables are included that encompass Algebra and Geometry concepts. My students love foldables! They make great study tools.
Included in this bundle pack are:
2D Shapes Formulas FoldableDescribing Statistics FoldableFactoring FoldableProperties of Quadrilaterals FoldableProving Triangles are Congruent FoldableSolving Quadratic Equations FoldableGraphing Transformed Equations Foldable
If you
Grades:
7th - 10th
CCSS:
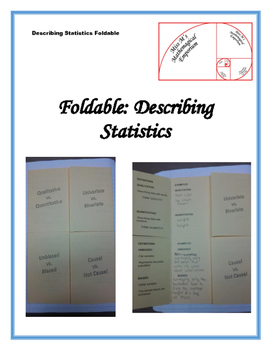
Describing Statistics Foldable
**Please read the instructions included to be able to print this product correctly!**
My students love foldables! They make great study tools. Included in this foldable are different ways of describing statistics, definitions, and examples. The different descriptors are univariate vs bivariate, qualitative vs. quantitative, causal vs. not causal, and unbiased vs. biased.
If you have any requests for foldables, please let me know. I'd be happy to create one to meet your needs!
Check out my ot
Subjects:
Grades:
9th - 12th
CCSS:
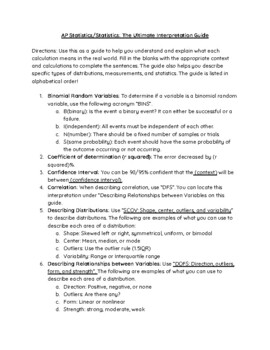
AP Statistics: Interpretations Guide: What does each statistic mean?
Hi teachers! This resource is great for your elementary, regular, or AP Statistics course. Students can use this guide all year long. We want our students to actually understand what they are calculating and connect their learning to real-world contexts! This resource will help them do just that. Some interpretations covered are mean, median, mode, and more. Here are the directions for use of the interpretations guide: Directions: Use this as a guide to help you understand and explain what each
Subjects:
Grades:
7th - 12th
CCSS:
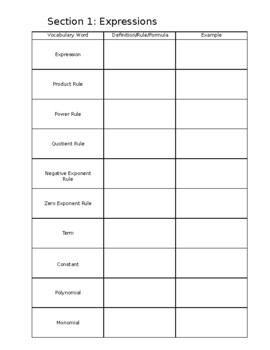
Algebra 1 EOC Vocabulary
Algebra 1 Vocabulary from each section. Completely edited. Answer key will be provided by 5/1.
Subjects:
Grades:
8th - 12th
Types:
CCSS:

Dr. Wimpey's Quick Reference for Statistics
I created this all-in-one document/foldable to help my statistics classes. It contains definitions, procedures, etc. It is useful for AP, honors, and CP levels in high school as well as college introductory statistics courses.
Subjects:
Grades:
11th - 12th, Higher Education
CCSS:
Showing 1-13 of 13 results

