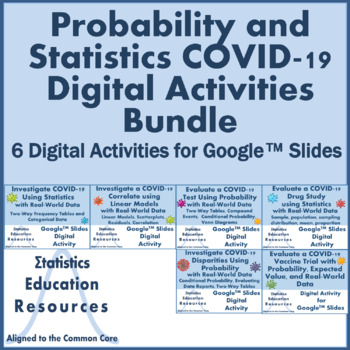
Bundle: Probability and Statistics COVID-19 Digital Activities (Common Core)
- Zip
- Google Apps™
- Internet Activities

Products in this Bundle (6)
showing 1-5 of 6 products
Description
Bundle: Probability and Statistics COVID-19 Digital Activities (Common Core)
This product is a bundle that includes 6 digital activities that were created in Google™ Slides. Each activity includes a background context relevant to COVID-19, summaries of real-world COVID-19 data derived from international or national health organizations or published research reports, detailed answer key, and instructions for accessing the activities. These activities are very challenging, focused on statistical literacy, and emphasize interpretation over rote mechanics.
COVID-19 has directly affected students’ lives and presents a timely unmissable teachable moment. In addition to practicing probability and statistics concepts, students will be introduced to concepts relevant to public health.
The activities include some editable features and are easy to share with your students via email, secure course website, or Google™ Classroom. Note that the actual activity pages are uneditable images; however, editable areas are provided for student responses. You get detailed answer keys, or you can create your own using the editable features.
The activities can be assigned for independent work, digital collaborative work, or for virtual “in class” learning. The activities can also be downloaded and printed in order to bridge the digital divide.
Note: These activities are aligned to Common Core standards that are often taught in algebra 1, geometry, algebra 2, or pre-calculus. This bundle is ideal for instructors who teach multiple math classes or who teach statistics courses, because not all activities may be appropriate for all classes. See the preview or each activity’s product page for specific standards.
Bundle Bonus:
This bundle is being offered at a discount of over 25% off the a la carte price.
We are pleased to feature clip art from TpT:
• Viruses © Take it and Teach at https://www.teacherspayteachers.com/Store/Take-It-And-Teach
Each resource includes:
1) A *.PDF with detailed instructions and a link to the resource
2) A *.PDF answer key
3) A *.PDF of teacher discussion questions (Investigate COVID-19 Disparities only)
About this product:
The materials in each resource have been compressed into a *.zip file. Software to unzip the file is necessary to use these materials. Software for reading PDF(*.pdf) documents is needed to use the files. A Google™ account is needed to access these materials.
This purchase is to be used by one teacher only for classroom use. These materials may not be shared without purchasing the appropriate number of licenses. These materials may not be redistributed or posted to the internet in any form except for secure classroom websites for classroom use only.
Prefer to purchase resources a la carte? Each activity can be found here:
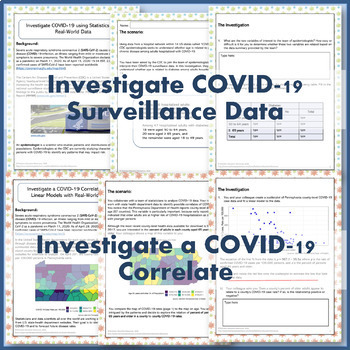
Distance Learning: Investigate COVID-19 using Statistics with Real-World Data
Distance Learning: Investigate a COVID-19 Correlate using Linear Models with Real-World Data
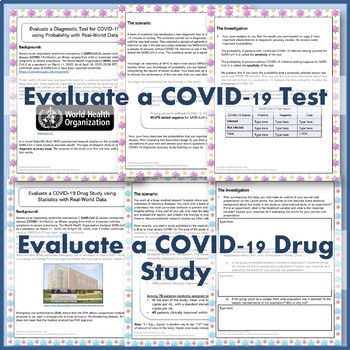
Distance Learning: Evaluate a COVID-19 Test using Probability with Real-World Data
Distance Learning: Evaluate a COVID-19 Drug Study with Statistics and Real-World Data
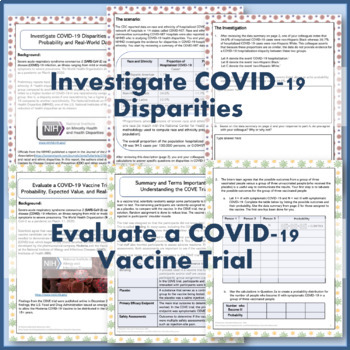
Distance Learning: Investigate COVID-19 Disparities using Probability with Real-World Data
Evaluate a COVID-19 Vaccine Trial with Probability, Expected Value, & Real Data
Want to earn TeachersPayTeachers credit for future purchases?
1) Login and visit your ‘My Purchases’ page
2) Click the ‘Provide Feedback’ button.
3) Leave a rating and quick comment.
4) Your feedback will help in creating future products for the teaching community.
Want to be first to learn more about Statistics Education Resources products?
1) Look for the green star near the top of the page by the store name, Statistics Education Resources.
2) Click it to be first to know about my new products, freebies, and discounts!
© Statistics Education Resources, 2020-2021
Disclaimer:
The National Governors Association Center for Best Practices and Council of Chief State School Officers are the sole owners and developers of the Common Core State Standards. © Copyright 2010. National Governors Association Center for Best Practices and Council of Chief State School Officers. All rights reserved.
This product is the work of Statistics Education Resources. Claims of alignment with the Common Core State Standards are the personal opinion of Statistics Education Resources and do not necessarily reflect the official views of the National Governors Association Center for Best Practices and Council of Chief State School Officers. No association with or endorsement by the National Governors Association Center for Best Practices and Council of Chief State School Officers is intended or implied.


