9 results
Common Core HSS-ID.C.9 independent work packets
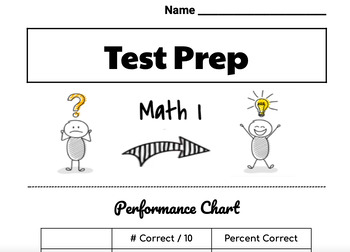
Math I End of Course Exam TEST PREP package
Math I End of Course Exam Test Prep packageIncludes 10 individual practice "lessons" that each contain 10 problems.Each practice lesson includes both a Calculator Inactive portion and a Calculator Active portion.The included Performance Chart allows for students to keep track of their progress as they strive to make improvement as they progress through the 10 lessons. I suggest providing each student a copy of the Performance Chart on colored paper to keep and record progress.The specific imple
Subjects:
Grades:
8th - 10th
CCSS:
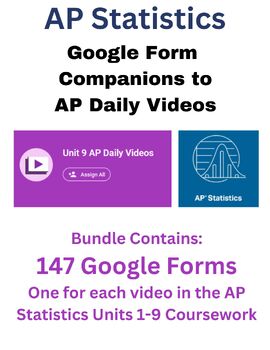
AP Statistics - 147 Google Form Companions for ALL AP Daily Videos
Do you require your students to watch the awesome AP Daily videos that College Board provides? Me too! But I needed a way to ensure the students were actually watching this resource and taking away all the valuable information they contain. These Google Forms allowed me to confirm that students were making the most of the AP Daily videos.This download contains 147 google forms. Each form is a companion to the 147 AP daily videos located in the AP Statistics course for all units from 1-9.
Subjects:
Grades:
9th - 12th
CCSS:
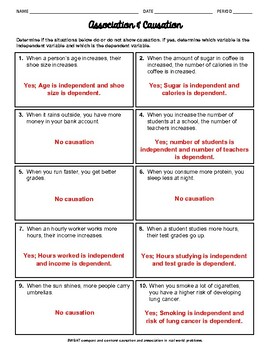
Association or Causation Worksheet
20 question worksheet on association and causation in real-world problems. #1 - 20 Given verbal descriptions (of 2 variables) determine if they show causation. If they do, tell which variable is the independent variable, and which is the dependent variable. Answer key included.VISIT US AT WWW.ALMIGHTYALGEBRA.COM FOR MORE RESOURCES AND BUNDLED DISCOUNTS!!
Subjects:
Grades:
7th - 12th
CCSS:
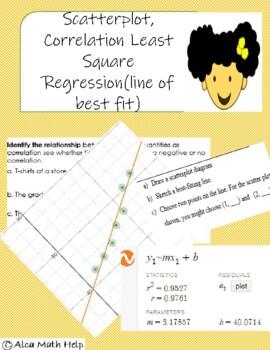
Scatterplot, Correlation and Least Square Regression (line of best fit)
At the end of this activity Students will be able to:1.Calculate the slope of a using points from the line of best fit.2.Estimate the strength and relationship between variables using a scatterplot.3.Explain correlation given the correlation coefficient4.Know facts about correlation●Answer Key included!●This activity sheet can be used as a Unit Quiz, Classwork or HomeworkIt comprises of short answer and true or false optionsPlease follow me by clicking this link
Subjects:
Grades:
11th - 12th, Higher Education, Staff
CCSS:
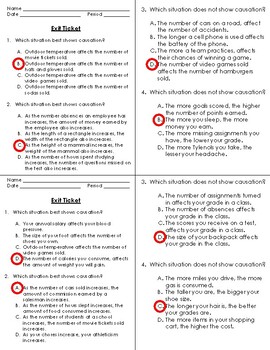
Association or Causation Exit Ticket
Exit ticket on comparing and contrasting association and causation in real-world problems.This exit ticket contains 4 multiple choice questions aligned to previously released STAAR exams. There is a version A and a version B to minimize cheating. Last page is an answer key.This exit ticket contains the following questions:#1: Which situation best shows causation? (Example answer: The number of calories you consume, affects the amount of weight you will gain.)#2: Which situation best shows causat
Grades:
7th - 12th
CCSS:
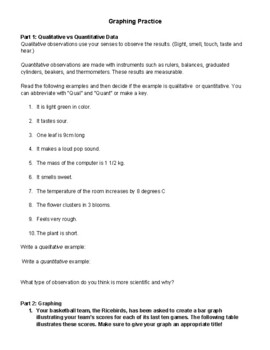
Graphing and Data Analysis Practice
A good practice for a high school science class after teaching students about different types of graphs and quantitative vs qualitative data. Can be used as an independent work packet in class or homework. Perfect for a remote assignment!
Subjects:
Grades:
8th - 12th
CCSS:
AP Statistics - AP Daily Videos: Unit 2 Google Form Companions
Do you require your students to watch the awesome AP Daily videos that College Board provides? Me too! But I needed a way to ensure the students were actually watching this resource and taking away all the valuable information they contain. These Google Forms allowed me to confirm that students were making the most of the AP Daily videos.This download contains 16 google forms. Each form is a companion to the 16 AP daily videos located in the AP Statistics Unit 2: Two Variable Data section.
Subjects:
Grades:
9th - 12th
CCSS:
Also included in: AP Statistics - 147 Google Form Companions for ALL AP Daily Videos

Scatterplot Practice, Income Inequality, Social Mobility, and The Gatsby Curve
In this three-part activity, students are introduced to two statistics used to describe economies: the Gini Coefficient (measuring income inequality) and Intergenerational Earnings Elasticity (IEE, measuring social mobility from generation to generation.) The activity revolves around scatter plots of Gini Coefficient vs. IEE.In part 1, focusing on placing/locating points on a scatter plot, students match verbal descriptions of fictional countries to points on a given scatter plot and are invited
Subjects:
Grades:
9th - 12th
CCSS:
Also included in: Scatter Plots, Income Inequality, and The Gatsby Curve
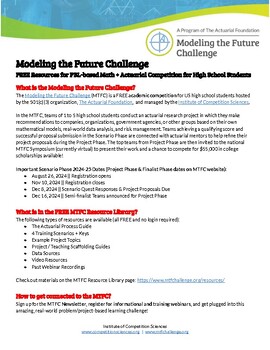
Flooding Losses Math Modeling Training Scenario (Instructor Version+Answers)
This is a training scenario that was created for the Modeling the Future Challenge (MTFC), a FREE problem/project-based learning competition for high school students. The DATA SET can be found here.This is one of many free resources that are available through the MTFC and is a fantastic opportunity for high school students to apply math concepts, have an authentic audience and mentors, and engage in interdisciplinary problem-solving work while competing for college scholarships. We invite you yo
Subjects:
Grades:
9th - 12th
CCSS:
Showing 1-9 of 9 results

