252 results
High school graphing laboratories
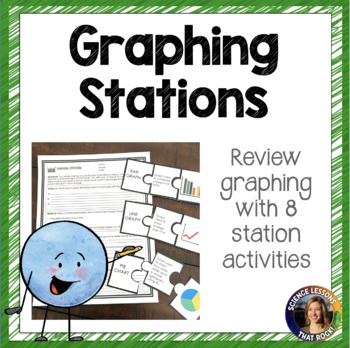
Graphing Station Activity
Included in this activity are 8 stations that are centered around graphing. The lesson is 17 pages and non-editable. See description below of each station and required materials.Station 1: At this station students determine which type of graph should be used based on 3 data sets. No additional materials are needed. Station 2: At this station students will create a best fit line and calculate slope. You will need to slide the page into a page protector, and provide a ruler, whiteboard marker, and
Subjects:
Grades:
8th - 10th
Types:
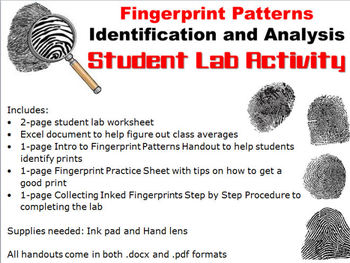
Forensic Science: Fingerprint Patterns Lab Activity
A great lab for any Forensic Science class studying fingerprints! Students learn to take fingerprints, identify fingerprint patterns, and collect class data to compare with national averages. It also helps students practice graphing.
Includes:
• 2-page student worksheet
• Excel document to help figure out class averages
• 1-page Intro to Fingerprint Patterns Handout to help students identify prints
• 1-page Fingerprint Practice Sheet with tips on how to get a good print
• 1-page Collecting Ink
Subjects:
Grades:
8th - 12th
Types:
Also included in: Forensic Science Fingerprints Unit Bundle

Beaker Pong: Experimental Design and Graphing Lab, NGSS aligned
Great 1st week or 1st month STEM activity! All parts are EDITABLE and includes a graphing grid! This is a great way to introduce the "science process" (better phrase for scientific method) at the start of a semester or anytime you want fun to occur in your classroom.*****Focus on the NGSS PRACTICES Dimension*****The National Research Council's (NRC) Framework describes a vision of what it means to be proficient in science; it rests on a view of science as both a body of knowledge and an evidenc
Subjects:
Grades:
7th - 12th
Types:
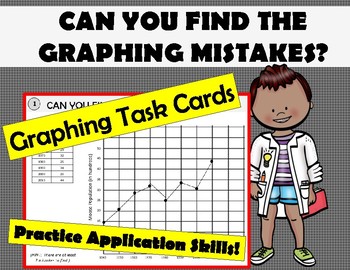
Can you find the LINE GRAPHING MISTAKES? 8 Graph Task Cards Application
Have you spent some time teaching graphing? Are students making the same mistakes over and over? Have them catch the mistakes with this task card activity.This product consists of 8 task cards; each with a set of data and a line graph that is graphed incorrectly (with at least 2 mistakes). Students need to find the mistake on each one!This can be done as a stations activity, a whole group lesson or as a pass game. As an enrichment for early finishers, included is a sheet for students to make
Subjects:
Grades:
5th - 10th
Types:
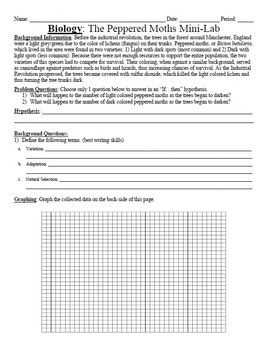
Natural Selection Peppered Moth data analysis
Students will examine data from the historical peppered moth experiment and answer several analysis questions and create a graph of the data. This is a great way to reinforce the concept of natural selection as the population sizes of two Peppered moths increase and decrease as the environment changes.Three items in this download:1) Peppered moth analysis (Word)2) Peppered moth analysis (pdf)3) Answer key for the peppered moth analysis (Word)Here are a few other Evolution-based lessons:Natural S
Subjects:
Grades:
6th - 12th
Types:
Anaerobic vs. Aerobic Respiration Lab
This lab asks students to pick a muscle group and push it to the point of anaerobic respiration. Students should have background knowledge before beginning this. This activity can be done using only a stop watch to time reps (sit-ups, push ups, etc.), but I like to borrow hand weights, yoga balls or pilates bands from the gym for extra fun. Kids really get into this activity!I have uploaded this in a .docx format, so you can edit and differentiate for your classroom and students' needs. Enjo
Grades:
7th - 12th
Types:
NGSS:
HS-LS1-7
Also included in: Photosynthesis and Respiration Bundle
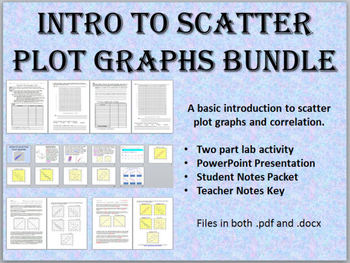
Introduction to Scatter Plot Graphs Bundle - Lab, Notes, PowerPoint Presentation
This Intro To Scatter Plot Graphs bundle contains:
• Intro to Scatter Plot Notes (2-page fill-in style student version and 2-page teacher version)
• PowerPoint Presentation (11 slides)
• Scatter Plot Lab Activity (4 pages)
• Files in both .pdf and .docx. PowerPoint is .ppt
This bundle contains a basic introduction to scatter plot graphs and correlation (perfect positive, perfect negative, high positive, low positive, high negative, low negative, and no correlation). Also includes a link to pra
Grades:
7th - 10th
Types:
Scientific Method NGSS Crosscutting Concepts Activity & PowerPoint
Students will have a great time learning about science skills, experimental design, NGSS Cross Cutting Concepts, and NGSS Science and Engineering Processes with this resource! And it's Google Ready! It's packed with teacher notes to make your job easy!All you need are two tennis balls per group, one meter stick per group and something to keep the tennis balls cold like a cooler or freezer. The data really shows the difference between the bounce of a cold tennis ball and a room temperature ball.
Subjects:
Grades:
5th - 12th
Types:
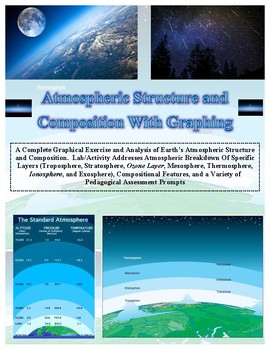
Atmospheric Layers Structure and Graphing LAB (An Earth Science Favorite!)
PROCEEDS BENEFIT "REACH INC."-EMPOWERING ADULTS WITH DISABILITIES
http://www.reachinc.org
Great COMBINATION of both math and science! This is an updated version by Southern Science Specialists.
New content, assessment prompts, and graphical template.
---------------------------------------------------------------------------------------------------------
See the "Extended Version" that additionally addresses the atmospheres of other planets found at the link below
CLICK HERE FOR EXTENDED VER
Subjects:
Grades:
5th - 10th, Adult Education
Types:
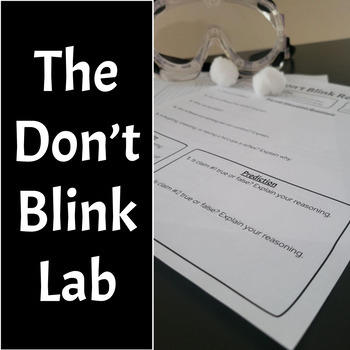
Don't Blink Lab (Reflexes, Nervous System, Data Collection, etc.)
This is a fun lab for students to test their ability to control a reflex like blinking. It works by having the students wear safety goggles and having their partner toss a cotton ball toward their eyes while they try not to blink! It's ton's of fun! The lab handout includes the following:Pre-Lab Discussion Questions Claims About Blinking As A Reflex and Blinking With Both EyesHas Students Make A Prediction Record Personal Data & Calculate AverageCollect & Graph Classroom DataAnalyze L
Subjects:
Grades:
7th - 10th
Types:
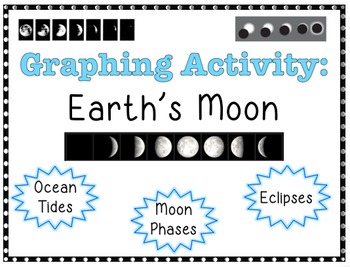
GRAPHING ACTIVITY Earth's Moon
This is a great way to incorporate graphing into a unit about Earth's Moon. Students will construct a total of 6 graphs (2 line graphs and 4 bar graphs) using data provided. Each part has questions to help students analyze the graph(s), apply information, and draw conclusions.
Part 1: Phases of the Moon
- Students will construct a line graph the percent of the illuminated part of the Moon seen from Earth each day for 1 month.
Part 2: Ocean Tides
- Students will construct a line graph for the
Subjects:
Grades:
8th - 12th
Types:
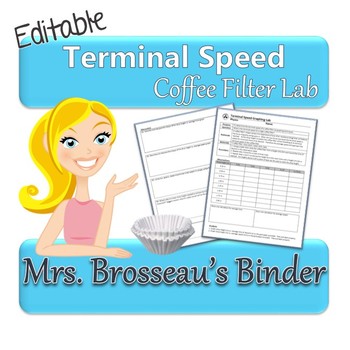
Terminal Speed Physics Lab & Graphing Activity using Coffee Filters {EDITABLE}
Do you want a teach your students about terminal speed, but can't find the time to put together a complex lab and then mark it all?
This is the lab for you!
This is part of my cost-saving, amazing Physics Bundle!
This is a quick lab that your students can complete start to finish in one class period. The student handout pages include:
• Purpose
• Question
• Rationale
• Materials
• Procedure
• Observation Table
• Graphing and Follow-up Questions + Conclusion
You'll need:
• meter stick
• coff
Grades:
7th - 12th
Types:
MS-PS4-1 Mathematical Models of Waves Lab | Printable, Digital & Editable
About SNAPs Lab Stations ActivitiesSNAPs Lab Stations Activities require students to use science, math, literacy, problem-solving and engineering skills. They are designed to enhance students' understanding of scientific concepts and help students apply scientific ideas to the real world. Each station activity promotes skills so to develop students into proficient and competent scientific thinkers.SNAPs lab activities have five components:• Science Skills Station to develop science skill profici
Subjects:
Grades:
5th - 9th
Types:
NGSS:
MS-PS4-1
Also included in: Physical Science Lab Stations Bundle | Printable, Digital & Editable
Paper Airplane Scientific Method Lab Report Write-Up with STEM Component
This is a summative assessment that assesses the scientific method and the process of writing up a lab report using paper airplanes. This assessment can also be easily differentiated based on the level of your students. This activity allows for independent work and accountability, partner or small group collaboration, and whole class data sharing so everyone is involved.
This file includes the following:
--Student directions
--Teacher directions
--Rough draft template for the lab report-wri
Subjects:
Grades:
6th - 10th
Types:
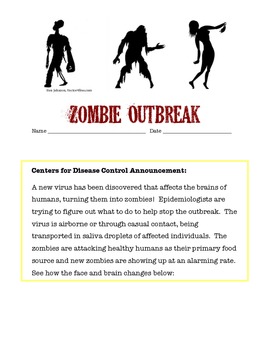
Investigating the Spread of a Viral Outbreak
Students in grades 5 - 9 model the spread of an infectious disease under the entertaining theme of a zombie outbreak. One student unknowingly is patient zero and students simulate the spread of an airborne illness. This highly engaging activity covers health topics, nature of science, and math skills as students graph data in a line plot. Higher level students can be challenged to find the function of the exponential growth of the outbreak.
Subjects:
Grades:
6th - 9th
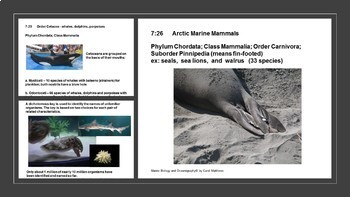
Polar Seas - Ocean/Marine Biology Unit 7
Polar Seas are unique habitats that influence climate and account for the diverse characteristics of polar animals such as Pinnipeds, Cetaceans and Penguins. They will use technology research skills, practice graphing from a computer program such as Excel, and to use photoperiods as a predictor to hemisphere location. Taxonomy is review by having students develop their own dichotomous key.Unit curriculum includes these bookmarked sections:IntroductionStudent SyllabusTeacher Pacing guideLesson Pl
Subjects:
Grades:
10th - 12th
Also included in: Marine Biology and Oceanography Full Year, 12 Unit Bundle
Flip Book Transformation Project
Students create a flip book using Power Point to discover and/or apply properties of geometric transformations. The student handout provides detailed instructions on how to create the flip book which includes using the “duplicate slide” feature in Power Point. Students are required* to create a minimum of 10 slides with 4 different movements. Students are given the opportunity to choose what type of movements they use within given parameters. This choice provides the opportunity for great di
Grades:
7th - 10th
Types:
Also included in: Transformations Bundle
Scientific Method Lab Report Write-Up Using Bouncy Balls
This is a very fun, hands-on lab to help students go through the process of the scientific method and learn how to accurately write-up a lab report. This could be used as a summative assessment to a scientific method unit, a culminating activity at the end of the year, or as an introductory assessment or review at the beginning of the year depending on the grade level. The focus of the activity is for students to take three bouncy balls and conduct an experiment to see which ball will bounce the
Subjects:
Grades:
6th - 9th
Types:
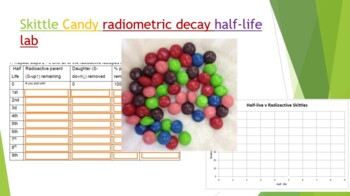
Skittle Radiometric Decay Half-life Lab
Did you know you can use Skittles candy to demonstrate absolute dating and radiometric decay! Buy a 1-4 lb bag at your local bulk warehouse store for savings. This lab is a great way to show how isotopes decay by shaking a plate full of random skittles. Students use Skittles to observe "Isotopes" decay over each half life. At the end of the lab (and only IF they have done all their work) they can enjoy their "daughter products". Skittles were used because they are durable, hypoallergenic, and th
Subjects:
Grades:
8th - 12th, Higher Education, Adult Education
Types:
NGSS:
HS-PS1-8
, HS-PS1-1
, HS-PS1-4
, HS-PS1-6
, MS-PS1-4
...
Also included in: Hands-on Science Semester Labs Bundle
Inverse Function Investigation with Desmos.com
In this online investigation, students use Desmos.com as a substitute for the traditional graphing calculator to investigate properties of inverse functions. This is a great introductory activity into inverse functions as it gives students a visual understanding of what a function and its inverse can look like. In the activity, students are instructed to create a table of values for a function, create the table of values for the inverse function, and graph the line y=x. In so doing, students
Subjects:
Grades:
8th - 9th
Types:
CCSS:
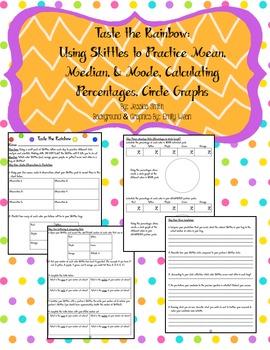
Data Analysis with Skittles Activity
This fun activity uses Skittles for each student to practice multiple skills!!! They will analyze the Skittles in their bag, collect and record data, and draw conclusions based on their analysis!
This activity will help students practice:
*Scientific Thinking: Predicting, comparing, concluding, & analyzing.
*Math: Mean, median, & mode, calculating percentages.
*Writing: Conclusion questions.
*Graphing: Creating circle graphs based on their data.
Students will work individually AND wit
Grades:
5th - 9th
Types:
Owl Vocabulary Information & Owl Pellet Data Sheet w/ Graphing Analysis
Tackling owl pellets this year! I love this activity! Here are a few sheets to get you started...a vocabulary/ information sheet on Barn Owls and a Student data sheet for collecting information while exploring the pellet.
These are PDF's but if you contact me with your email, I can send you the editable version!
This works great with my Vole Skeleton template for Owl pellets:
http://www.teacherspayteachers.com/Product/Vole-Skeleton-template-for-Owl-pellets-281440
Good luck!
This is part
Subjects:
Grades:
5th - 9th
Types:
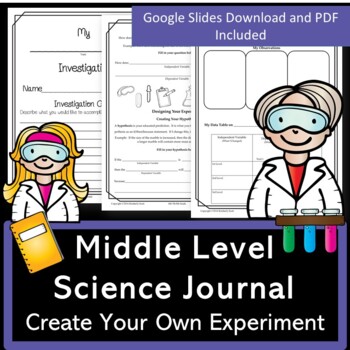
Science Experiment Journal Template | Digital Or Print | Grades 6 7 8
Are you looking to create hands-on investigations with your middle-level students? Help students think like a scientist using a lab report template. Included are an editable Google Slide document and a PDF version. We will take you step by step in designing unique experiments on the topic of your choice.A Google Slide version is included. We feel this journal is great to assign students to perform an experiment at home. During this time of digital learning, students can use supplies they have
Subjects:
Grades:
6th - 9th
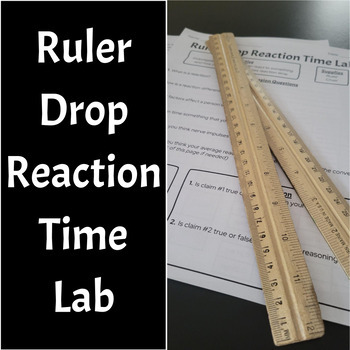
Ruler Drop Reaction Time Lab (Data Collection & Nervous System)
This is a fun lab for students to test their reaction times using the ruler drop method. The lab handout includes the following:Pre-Lab Discussion Questions Claims About Reaction Time & Dominant vs. Non-Dominant HandHas Students Make A Prediction Record Personal Data & Calculate AverageCollect & Graph Classroom DataAnalyze Lab SectionBackground Information Section (Only Briefly Explains The Biology of Reaction Times)PDF & Editable Copies IncludedFollow My Store By Clicking Here
Subjects:
Grades:
7th - 10th
Types:
Showing 1-24 of 252 results


