15 results
Common Core HSS-ID.A.4 internet activities
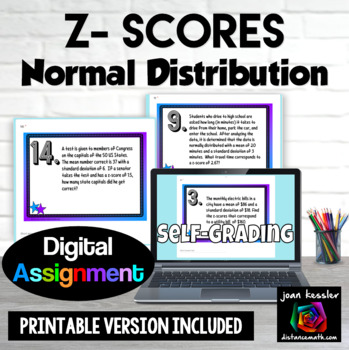
Normal Distribution Z-Scores Digital plus Print
Your students will get extra practice and gain fluency learning about z-scores and the Normal Distribution with both a self-grading digital resource and a PDF printable version. There are 16 applications to solve with a mix of multiple choice and free response including: finding the z-scorefinding the standard deviation knowing the z-score, mean, and data point finding the mean knowing the z-score, data point, and standard deviationinterpreting the z-score. Your download includes:PDF with link
Subjects:
Grades:
9th - 12th
Types:
CCSS:
Also included in: Probability and Statistics Algebra 2 Unit 11 Activity Bundle
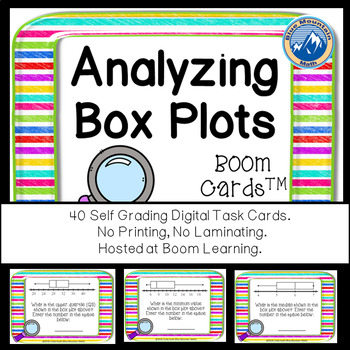
Analyzing Box Plots Boom Cards--Digital Task Cards
Boom Cards™ are a great way for students to practice skills analyzing Box Plots--formerly called Box and Whisker Plots. You can assess their understanding and students can play again to keep improving. This set uses a variety of different plots and asks question about lower quartile, upper quartile, median, interquartile range, range and outliers. This set of Boom Cards features 40 different Digital Self-Checking Task Cards. (No printing, cutting, laminating, or grading!)
Boom Cards live in the
Subjects:
Grades:
7th - 10th
Types:
CCSS:
Also included in: Algebra 1 Bundle Boom Cards--Digital Task Cards Distance Learning
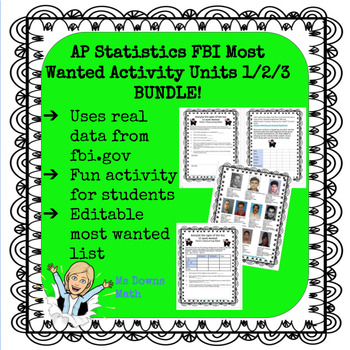
FBI Most Wanted AP Stat - Analyze Data, Normal Distributions, Linear Regression
I have created a series of activities for several units in the AP Statistics curriculum. The students love using data from fbi.gov to review concepts. This activity involves analyzing data related to the top 10 most wanted fugitives. I created this activity in May of 2020 and used the top 10 at that time. In the folder, you will find an editable slide of the top 10 if you want to change it.The answer key for the unit is based on the original top 10 that I used. Teachers have the option of having
Subjects:
Grades:
10th - 12th
Types:
CCSS:

Z-Scores using Google Forms™ | 2 Assessments or Homework
✯Two Self-Grading Algebra 2 Assessments or homework assignments using Google Forms™ - 48 total multiple choice and checkbox questions. 24 questions on each form. Topics covered: Finding and interpreting z-scores Finding data points when given the mean, z-score, and standard deviation Finding probabilities/percentiles using z-tables (or the invNorm command) Finding data points/ranges using z-tables (or the normalcdf command) See sample questions above! The preview shows various types of questi
Subjects:
Grades:
9th - 12th
Types:
CCSS:
Also included in: Algebra 2 Google Forms™
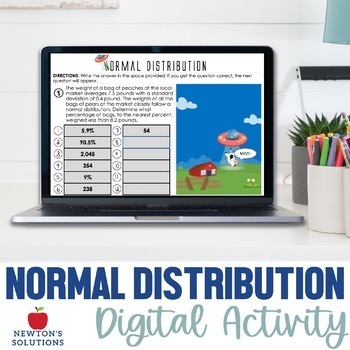
Standard Deviation and Normal Distribution Digital Activity
Looking for an activity to engage Algebra 2 students who are learning about normal distribution? In this no prep digital activity, students will use the mean and standard deviation of a data set to fit it to a normal distribution and to estimate population percentages. Students will need to use their calculators (normalcdf on TI-84) to estimate the area under a curve. This is a self-checking activity that provides immediate feedback for Algebra II students. This digital activity is perfect for s
Subjects:
Grades:
9th - 11th
Types:
CCSS:
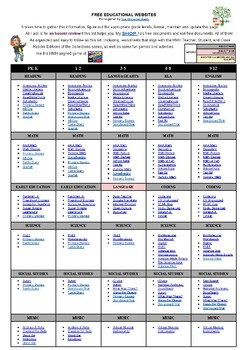
FREE EDUCATIONAL WEBSITES LIST 4 ALL GRADES K-12 AND SUBJECTS + TEACHER RESOURCE
Sometimes, you just need a list of websites for everyone. Here it is. FREE EDUCATIONAL WEBSITES Put together by Teach Me, Maria!It takes time to gather this information, figure out the appropriate grade levels, and format, maintain, and update this page. All I ask is for an honest review if this list helps you.
Subjects:
Grades:
PreK - 12th, Staff
Types:

Mean Median Mode Range Digital|Printable Valentine's Day Activity for Algebra
Give your students a fun and engaging way to practice Mean, Median, Mode, and Range (measures of central tendency) with this Self-Checking Digital and Printable Magic Word Search activity. There are 10 questions that students will find the mean, median, mode, and range of real-world scenarios. ➡️The questions are a task card so the students will only see 1 question at a time. ✅This resource is perfect for Distance Learning (zero prep) or in the classroom. There is a worksheet that you can use
Subjects:
Grades:
7th - 9th
Types:
CCSS:
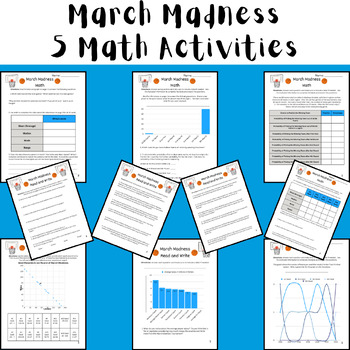
March Madness Men's Math - 5 Activities (Data + Graphs) Printable & Digital 2024
These 5 activities are fun NO PREP math activities to do to celebrate March Madness! The activities can be completed as 5 separate activities, stations, or as a multi-page packet. There is a fully customizable digital resource (Canva Template) and a printable resource (Canva) that contain the same directions and activity for each resource. This was designed for students in middle school, but could be used for upper elementary and high school students in Pre Algebra, Pre-Algebra, or Algebra.In th
Subjects:
Grades:
3rd - 12th
Types:
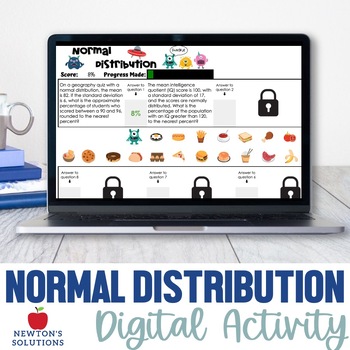
Normal Distribution Digital Activity
Engage your Algebra 2 students with this fun and interactive digital activity!In this no-prep activity, students will use the mean and standard deviation of a data set to fit it to a normal distribution and to estimate population percentages. Additionally, students will need to use their calculators to estimate areas under the normal curve. This self-checking activity provides immediate feedback, so students can see how they are doing and make corrections as needed.The activity is also gamified,
Subjects:
Grades:
10th - 12th
Types:
CCSS:
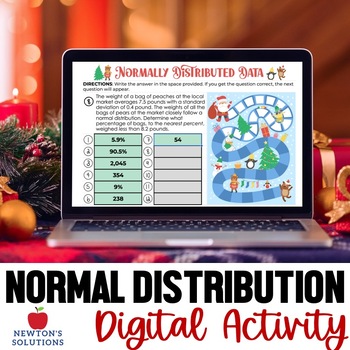
Normal Distribution Digital Christmas Activity
Looking for a winter activity to engage Algebra 2 students who are learning about normal distribution during the holiday month? In this no prep digital Christmas activity, students will use the mean and standard deviation of a data set to fit it to a normal distribution and to estimate population percentages. Students will need to use their calculators (normalcdf on TI-84) to estimate the area under a curve. This is a self-checking activity that provides immediate feedback for Algebra II student
Subjects:
Grades:
9th - 11th
Types:
CCSS:
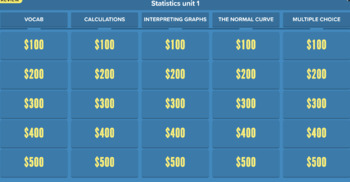
AP stats Unit 1 review jeopardy-style game
Included in purchase is the answer key in order (Category 1 $100-500, category 2 $100-500, etc.) and the link to the jeopardy game website. Membership is not needed to play on the website, but you will need to upgrade to pro on their site if you want the buzzer mode (not necessary but fun if your students are very competitive) follows Unit one vocab and example problems of AP Statistics (Categorical and quantitative data, normal curve)
Subjects:
Grades:
11th - 12th
Types:
CCSS:
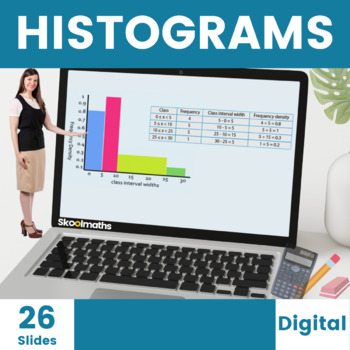
Histograms Digital Lesson for High School
Teach your High School students how to Interpret and Construct Histograms with unequal class intervals with these completely interactive digital home learning resources with engaging content and instant learner feedback. Buy this great value 26-page bundle of interactive histogram activities today to save you hours of planning and don't forget to leave an honest review if you download this worksheet for TPT credit :)Like this? You might also like...Conditional ProbabilityCalculating AveragesCond
Subjects:
Grades:
8th - 10th, Higher Education
CCSS:
Also included in: Complete Statistics and Probability Bundle | Digital and Print
16:31
Normal Distribution Video Lesson with Guided Notes
This video lesson is perfect for sub plans, class activities, math centers, remedial help, or flipping your class. This video lesson teaches students about normal distribution. In particular, your students will be able to...Illustrate normal distribution as a bell curveDescribe the normal distribution of the bell curve and how it relates to standard deviationFind the z-score for a set of data You receive not only the instructional video but accompanying notes for students to complete as they wat
Subjects:
Grades:
8th - 9th
Types:
CCSS:
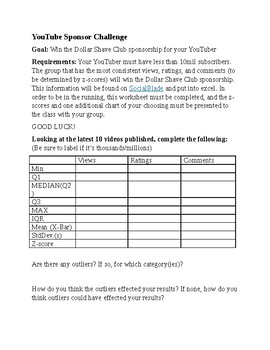
Youtube 5 Number Summary Challange
Students have to use statistical knowledge to win this challenge using their favorite youtubers statistics. Meets standards: HSS-ID.A.1HSS-ID.A.2HSS-ID.A.3HSS-ID.A.4CCRA.SL.1CCRA.SL.2CCRA.SL.4CCRA.SL.5
Subjects:
Grades:
10th - 12th, Higher Education, Adult Education
Types:
CCSS:
19:11
Interpreting Statistical Data Video Lesson with Guided Notes
This video lesson is perfect for sub plans, class activities, math centers, remedial help, or flipping your class. This video lesson teaches students how to interpret statistical data. In particular, your students will be able to...Find the mean, median, mode & rangeExplain what deviation and variance areFind the deviation of a specific data pointFind the variance of a set of data Find the standard deviation of a set of dataFind the z-score for a specific data pointYou receive not only the i
Subjects:
Grades:
8th - 9th
Types:
CCSS:
Showing 1-15 of 15 results

