17 results
Common Core HSS-ID.A.4 independent work packets
AP Statistics - 147 Google Form Companions for ALL AP Daily Videos
Do you require your students to watch the awesome AP Daily videos that College Board provides? Me too! But I needed a way to ensure the students were actually watching this resource and taking away all the valuable information they contain. These Google Forms allowed me to confirm that students were making the most of the AP Daily videos.This download contains 147 google forms. Each form is a companion to the 147 AP daily videos located in the AP Statistics course for all units from 1-9.
Subjects:
Grades:
9th - 12th
CCSS:

How to Use Desmos on Algebra 1 State Tests & EOC Exams PART 1
This is Part 1 of a 3 part series of lessons on using the Desmos graphing calculator to improve performance on Algebra 1 State Tests and EOC Exams.
Subjects:
Grades:
8th - 12th
CCSS:
Also included in: How to Use Desmos on Algebra 1 State Tests & EOC Exams

How to Use Desmos on Algebra 1 State Tests & EOC Exams PART 2
This is Part 2 of a 3 part series of lessons on using the Desmos graphing calculator to improve performance on Algebra 1 State Tests and EOC Exams.
Subjects:
Grades:
8th - 12th
CCSS:
Also included in: How to Use Desmos on Algebra 1 State Tests & EOC Exams

How to Use Desmos on Algebra 1 State Tests & EOC Exams PART 3
This is Part 3 of a 3 part series of lessons on using the Desmos graphing calculator to improve performance on Algebra 1 State Tests and EOC Exams.
Subjects:
Grades:
8th - 12th
CCSS:
Also included in: How to Use Desmos on Algebra 1 State Tests & EOC Exams
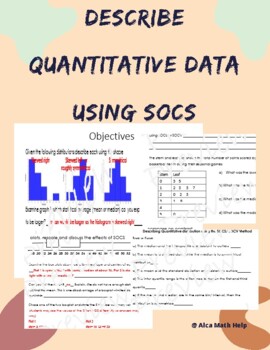
Describe Quantitative Data using SOCS/SOCV- Box plot, Histogram, Stem plot
If you are looking for a worksheet that can be used as a quiz, test, review packet you are at the right place. This activity sheet is suitable for students doing AP Stats and CP Probability and Statistics. This activity sheet allows students to:Use prior knowledge to answer true false questions and fill in the blanks with vocabulary provided.Describe box plots, histogram and stem plot using SOCS.Interpret the shape, center, outlier or any unusual feature along with the spread.
Subjects:
Grades:
11th - 12th, Higher Education, Adult Education, Staff
CCSS:
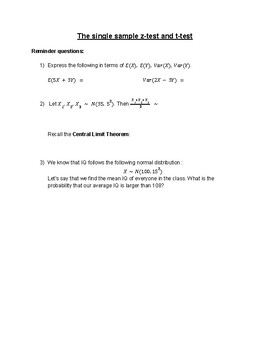
The z-test and t-test, IB HL Applications and Interpretations
In this fun activity, students are introduced to the z-test and t-test. They will spend 10 minutes taking a quick IQ test to generate data (which is included with answers), which will then be used to explore the question 'is the IQ of our class higher than that of the general population'. Unbiased estimators are also introduced. Full teacher version with answers included, although the answers will be different depending on the outcome of the student quizzes. Geared towards Higher Level IB Applic
Subjects:
Grades:
10th - 12th
CCSS:
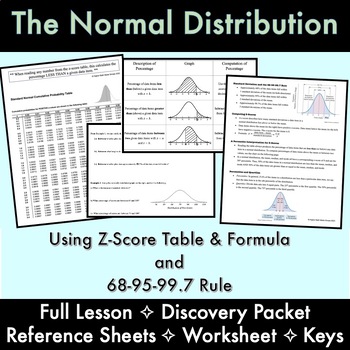
NORMAL DISTRIBUTION: Lesson, Class Packet, Homework, Reference Sheets, & KEYS
Students see first-hand in the Normal Distribution DISCOVERY scaffolded packet how the mean equates to z-score= 0, and they can use the shortcut method to determine integer z-values [adding/subtracting the standard deviation]. Students learn how to sketch a bell curve based on the give mean and standard deviation, and interpret the percentages using the z-score formula, chart and 68-95-99.7 Rule.Teaching this for many years I have finally perfected the SCAFFOLDED FLOW of introducing Normal Distr
Subjects:
Grades:
9th - 12th, Higher Education, Adult Education
CCSS:

Histograms Digital Lesson for High School
Teach your High School students how to Interpret and Construct Histograms with unequal class intervals with these completely interactive digital home learning resources with engaging content and instant learner feedback. Buy this great value 26-page bundle of interactive histogram activities today to save you hours of planning and don't forget to leave an honest review if you download this worksheet for TPT credit :)Like this? You might also like...Conditional ProbabilityCalculating AveragesCond
Subjects:
Grades:
8th - 10th, Higher Education
CCSS:
Also included in: Complete Statistics and Probability Bundle | Digital and Print
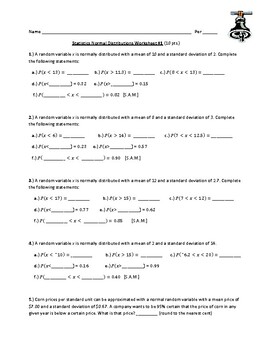
Normal Distributions Worksheet #1
Practice finding probabilities and finding boundaries on a Normal Probability Distribution. Also includes a review section covering topics typically taught earlier in a Statistics course.First in a series of three review worksheets which can all be assigned individually or together as a total review package.Note: In this worksheet, S.A.M. is used as an abbreviation for "symmetric around/about the mean."
Subjects:
Grades:
11th - 12th, Higher Education
CCSS:
AP Statistics - AP Daily Videos: Unit 1 Google Form Companions
Do you require your students to watch the awesome AP Daily videos that College Board provides? Me too! But I needed a way to ensure the students were actually watching this resource and taking away all the valuable information they contain. These Google Forms allowed me to confirm that students were making the most of the AP Daily videos.This download contains 14 google forms. Each form is a companion to the 14 AP daily videos located in the AP Statistics Unit 1: One Variable Data section.
Subjects:
Grades:
9th - 12th
CCSS:
Also included in: AP Statistics - 147 Google Form Companions for ALL AP Daily Videos
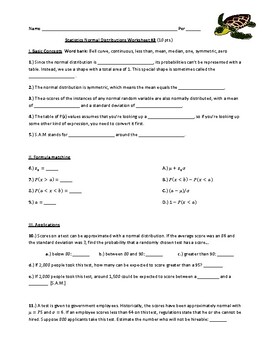
Normal Distributions Worksheet #3
Practice finding probabilities and finding boundaries on a Normal Probability Distribution. Also includes a review section covering topics typically taught earlier in a Statistics course.Third in a series of three review worksheets which can all be assigned individually or together as a total review package.Note: In this worksheet, S.A.M. is used as an abbreviation for "symmetric around/about the mean."
Subjects:
Grades:
11th - 12th, Higher Education
CCSS:
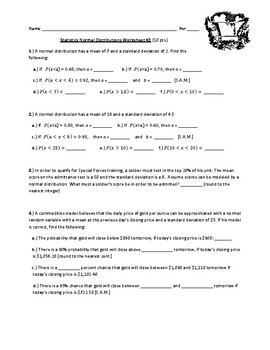
Normal Distributions Worksheet #2
Practice finding probabilities and finding boundaries on a Normal Probability Distribution. Also includes a review section covering topics typically taught earlier in a Statistics course.Second in a series of three review worksheets which can all be assigned individually or together as a total review package.Note: In this worksheet, S.A.M. is used as an abbreviation for "symmetric around/about the mean."
Subjects:
Grades:
11th - 12th, Higher Education
CCSS:
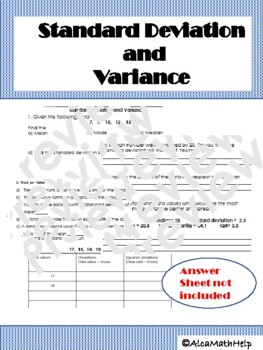
Standard Deviation and Variance AP Stats, CP probability and Statistics
If you are looking for an activity sheet that will help students to practice standard deviation and variance both by hand and the table. This is the activity you are looking for. Not too complex but requires some level of thinking.Objectives:1. Students should be able to interpret the relationship between the mean and standard deviation. 2. Students should know how the change in variables affects the spread and center. 3.Students will be able to complete a knowledge-based section by answering tr
Subjects:
Grades:
10th - 12th, Higher Education, Adult Education, Staff
CCSS:
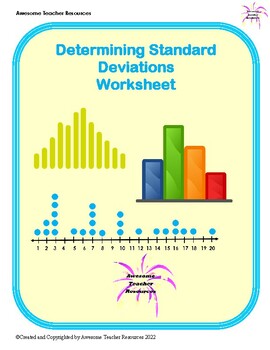
Determining Standard Deviations Worksheet
This worksheet begins with suggestions for reinforcement or enrichment with regards to data. In an effort to help students, there is an example problem at the start of the worksheet with step-by-step directions for finding the mean and standard deviation for a set of data. Then there are 5 problems, three of which have a set of data provided. The last 2 problems require students to have access to a 6-sided die and a deck of cards. Tables are provided to help organize calculations. There is an a
Subjects:
Grades:
7th - 10th
CCSS:
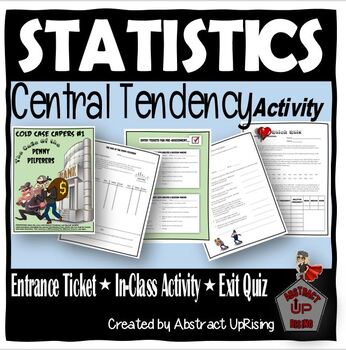
The Case of the Penny Pilferers!
A fun, hands-on activity spanning 3-4 days that covers Data Organization (Tally Charts and Tables), Graphing (Histogram, Pareto Chart, and Time-Series Graph), and Central Tendency. Students will be conducting an experiment with pennies as the detectives on the case. Working with partners, they will be analyzing their penny sample to determine if the bank robbers from a cold case are at it again! Examples of each graph are given and the activity is suitable for many different ability levels.
Subjects:
Grades:
11th - 12th
CCSS:
Sampling and Statistics Take Home Packet
This packet can be used for many different needs. I am currently using this for virtual learning and giving it to students who need something different or more to understand the concepts. This resource is designed for supplemental instruction and can be used for reteaching, absent students, distance learning or additional practice. The topics included are: sampling methods, understanding changes in mean and median, interpreting box and whisker plots, interpreting histograms and interpreting stan
Subjects:
Grades:
8th - 11th
CCSS:

Video Game Themed HyperDoc - Data Visualization
This hyper doc is a review of Unit 1 for Integrated Math 1. This review covers box plots, bar charts, histograms, and dot plots. Common Core Standards: CCSS: S.ID.A.1CCSS: S.ID.A.2
Subjects:
Grades:
8th - 12th
CCSS:
Showing 1-17 of 17 results

