43 results
Common Core HSS-ID.A.4 printables
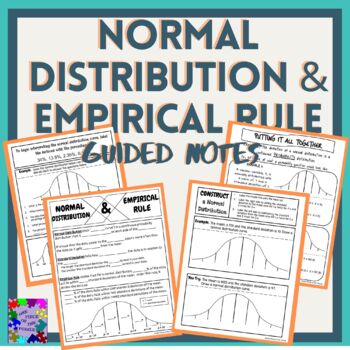
Normal Distribution and Empirical Rule Guided Notes
The guided notes provides students the definitions of normal distribution, standard deviation, and empirical rule. These concepts are explained and applied throughout the notes and building upon each other as the lesson progresses.Includes 4 page of notes and the corresponding key. This was designed to satisfy the common core standard: CCSS.HSS-ID.A.4Georgia Standard: MGSE9-12.S.ID.4
Subjects:
Grades:
11th
CCSS:
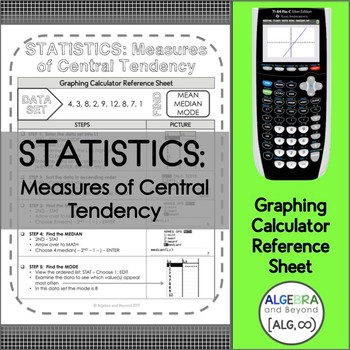
Statistics | Measures of Central Tendency | TI-84 Calculator Reference Sheet
This graphing calculator reference sheet on measures of central tendency guides students step-by-step on how to create a list and find the mean, median and mode.Teaching graphing calculator skills help students with: • Speed• Making connections• Checking for accuracy• Leaping hurdles*Reference sheet can be used with a TI-83 or TI-84 graphing calculator. Please look at the preview to find out more information about this resource.Check out more graphing calculator sheets here or get all of them...
Subjects:
Grades:
10th - 12th
Types:
CCSS:
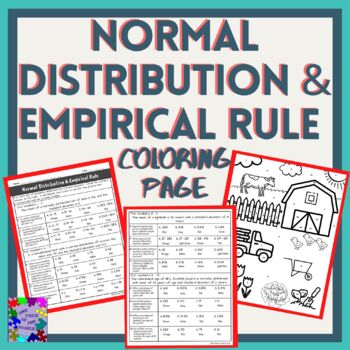
Normal Distribution and Empirical Rule Practice Coloring Page
The activity allows the students to practice interpreting a normal distribution and using the Empirical Rule to answer questions about data. The choices correspond to the coloring page and tells what color to use on specific parts.Includes 2 page of questions with 1 coloring page and the correspond key. This was designed to satisfy the common core standard: CCSS.HSS-ID.A.4Georgia Standard: MGSE9-12.S.ID.4
Subjects:
Grades:
11th
Types:
CCSS:
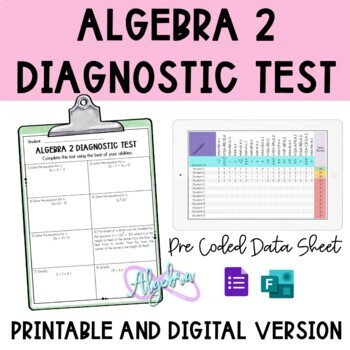
Algebra 2 Diagnostic Test Printable and Digital (Back to School)
Want to know where your students are at the beginning of the year to plan sucessfully? This math diagnostic test will help you identify their weaknesses and strenghts so you can access and differentiate for each of your students. Once you analyze the data you will be able to teach your current level standards while having interventions on the most needed pre-course skills. What's included?Algebra 2 Diagnostic Test (Digital and Printable)Digital version in both Google Form™ and Microsoft Form™Sta
Grades:
9th - 11th
Types:
CCSS:
Also included in: Diagnostic Test for Algebra 1, Geometry and Algebra 2 FULL PACK
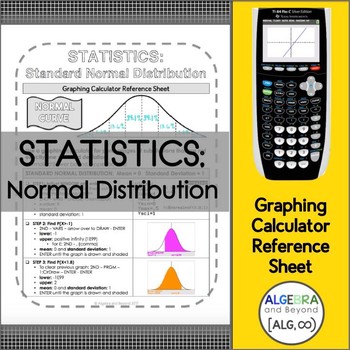
Normal Distribution | Statistics | TI-84 Graphing Calculator Reference Sheet
This graphing calculator reference sheet on normal distribution guides students step-by-step on how to calculate percentages and graph the curve. (Normal and Standard Normal Distribution included)Teaching graphing calculator skills help students with: • Speed• Making connections• Checking for accuracy• Leaping hurdles*Reference sheet can be used with a TI-83 or TI-84 graphing calculator. Please look at the preview to find out more information about this resource.Check out more graphing calculato
Subjects:
Grades:
10th - 12th
Types:
CCSS:
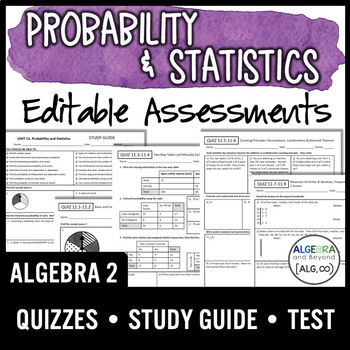
Probability and Statistics Assessments | Quizzes | Study Guide | Test
These assessments will help you assess your students' skills on probability and statistics! The EDITABLE assessments cover basic, compound, independent, dependent, and mutually exclusive events and probabilities. Students analyze scenarios for the counting principles, permutations, and combinations. Statistics included are measures of variation, frequency, normal distribution, and z-scores. Print and go OR edit to meet your standards.INCLUDED:4 Quizzes, a Study Guide, and a Unit TestTOPICS:Basic
Subjects:
Grades:
9th - 11th
Types:
CCSS:
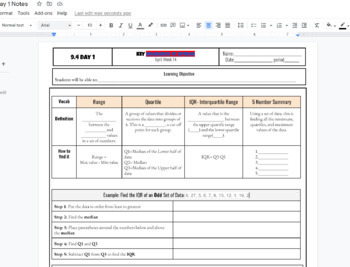
IQR interquartile Range and 5 number summary box and whisker plot Notes
IQR interquartile Range and 5 number summary box and whisker plot Notes including Q1, Q2, Q3, Min and Max and step by step both examples of finding the IQR and creating a box and whisker plot. Used in HS math 1 class WITH KEY INCLUDED AS a link to a printable PDF
Subjects:
Grades:
7th - 12th, Higher Education, Adult Education
CCSS:
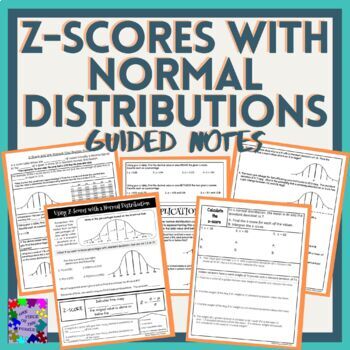
Z-Scores with Normal Distributions Guided Notes
The guided notes provides detailed scaffolding for the concept of using z-scores. It provides explanations of why and how to use a z-score as well as interpreting it. Application problems are also included.Pre-requisites: Students should already know about a normal distribution curve and the Empirical Rule.Includes 5 page of notes and the corresponding key. This was designed to satisfy the common core standard: CCSS.HSS-ID.A.4Georgia Standard: MGSE9-12.S.ID.4
Subjects:
Grades:
11th
CCSS:
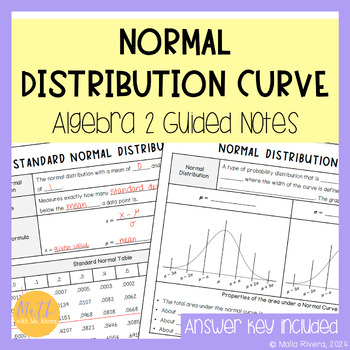
Normal Distribution Curve Guided Notes for Algebra 2 No Prep
This set of guided notes will walk Algebra 2 students through understanding and calculating normal distribution curve and z-scores. All you need to do is print & make copies for your students! A suggested, detailed answer key is included for all pages. Topics included:Properties of the Normal Distribution CurveFinding probability distributionsStandard Normal Distribution CurveCalculating z-scores & probabilitiesThese notes are perfect to use as a handout or easily hole-punched and added
Subjects:
Grades:
10th - 11th
CCSS:
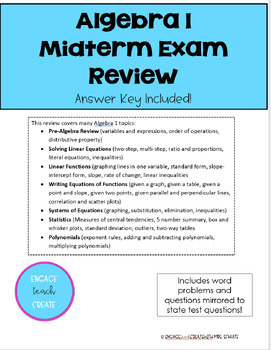
Algebra 1 - Mid-Term Exam Review with Key
This review covers many Algebra 1 topics: · Pre-Algebra Review (variables and expressions, order of operations, distributive property) · Solving Linear Equations (two-step, multi-step, ratio and proportions, literal equations, inequalities) · Linear Functions (graphing lines in one variable, standard form, slope-intercept form, slope, rate of change, linear inequalities· Writing Equations of Functions (given a graph, given a table, given a point and slope, given two points, given parallel and pe
Subjects:
Grades:
8th - 11th
Types:
CCSS:
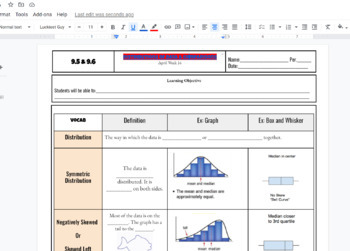
Distributions of Data Scaffolded Fillable Notes (Skewed Left & right) w/ KEY
Distributions of Data Scaffolded Fillable Notes (Skewed Left & right) Includes a problem of creating box plot, bar chart, and dot plot. KEY IS INCLUDED linked at top of title highlighted in red!!! , Algebra 1 or Math 1 class in highschool setting IEP 504 EL learners visuals for better understanding. YOU CAN EDIT THE GOOGLE DOC to your liking!!!
Subjects:
Grades:
7th - 12th, Higher Education, Adult Education
CCSS:
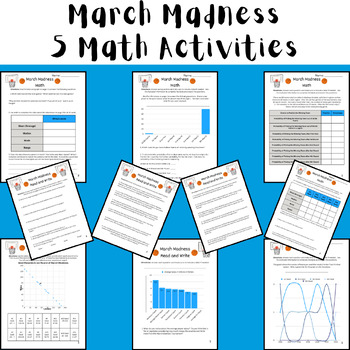
March Madness Men's Math - 5 Activities (Data + Graphs) Printable & Digital 2024
These 5 activities are fun NO PREP math activities to do to celebrate March Madness! The activities can be completed as 5 separate activities, stations, or as a multi-page packet. There is a fully customizable digital resource (Canva Template) and a printable resource (Canva) that contain the same directions and activity for each resource. This was designed for students in middle school, but could be used for upper elementary and high school students in Pre Algebra, Pre-Algebra, or Algebra.In th
Subjects:
Grades:
3rd - 12th
Types:
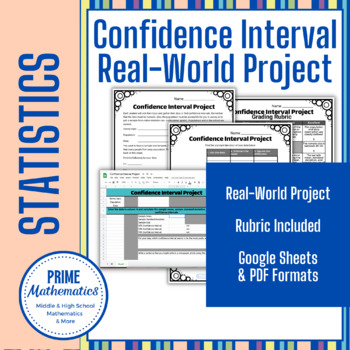
Confidence Interval Real-World Project
Description:This student-directed real-world project with pdf and Google Sheets versions involves the students collecting data, finding the sample mean and standard deviation, and calculating the 90%, 95%, and 99% confidence intervals. They get to choose the topic and population.This product includes:a form for each student to complete about the details of the statistical studya standard deviation graphic organizer for 20 pieces of data in pdf form and on Google sheetsa grading rubric for the pr
Subjects:
Grades:
9th - 12th
Types:
CCSS:
Also included in: Statistics Projects BUNDLE
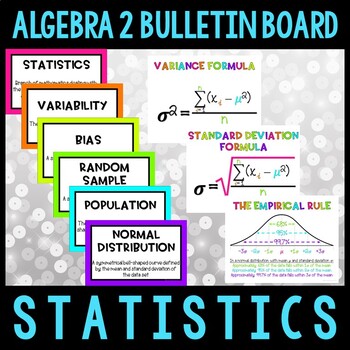
Statistics Algebra 2 Bulletin Board
Create a fun, instructional display in your high school classroom using this Statistics Bulletin Board for common core algebra 2! Download includes 8.5 x 11 inch pdf posters in both color and black & white for printing on color paper. Bulletin boards can work in high school classrooms too! This bulletin board idea can help your students review and recall concepts they need to know.What's included:Vocabulary (words print two per page): statistics, variability, bias, random sample, populat
Subjects:
Grades:
11th
CCSS:
Also included in: Algebra 2 Bulletin Board Bundle
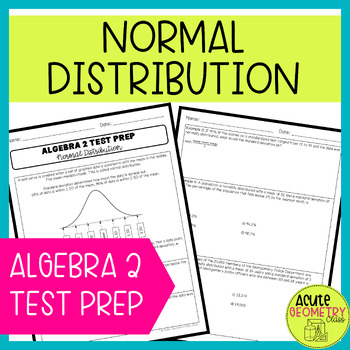
Normal Distribution Practice Worksheet - Algebra 2 End of Year Review Test Prep
Algebra 2 teachers -- need to review normal distribution with your students to help them prepare for a unit test or end of year exam? This 2-page test prep worksheet gives students practice with normal distribution, means, and standard deviation.About This Resource: Review of normal distribution5 practice problems (2 multiple choice)Great for preparing for a unit test or end of year examIdeal for review; this resource is not intended for teaching a new topicTeach in NY? This resources includes q
Subjects:
Grades:
10th - 11th
Types:
CCSS:
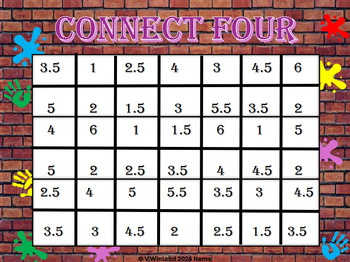
Connect Four ( Statistics)
Statistics Connect FourConnect four by rolling dice and finding averages.Students have to keep track of frequency and relative frequency.Also create a histogram and decide if frequencies create a uniform, normal curve or skewed curve.
Subjects:
Grades:
10th - 12th, Higher Education, Adult Education
Types:
CCSS:
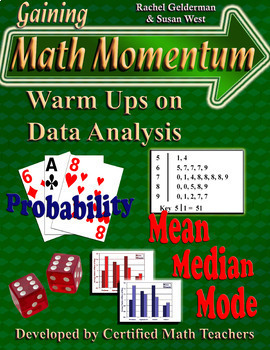
Data Analysis Review Warm-Ups - Probability & Statistics Bell Ringers - Level 1
Review and reinforce basic concepts in probability & statistics with these multiple choice math warm-ups! Quickly assess students’ knowledge and mastery in this critical area! Use the detailed, easy-to-understand solutions to reteach essential math skills!! This set of 15 problem pages (3 problems per page) with detailed solutions was developed by two certified high school math teachers based on standardized testing’s increased emphasis on data analysis. Topics include simple and compound
Subjects:
Grades:
7th - 10th
Types:
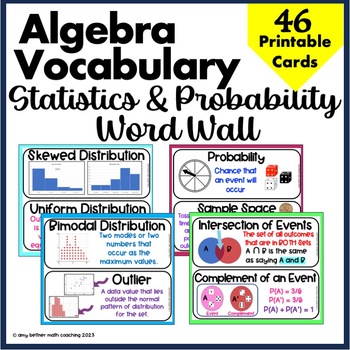
Statistics and Probability Word Wall
Are your students struggling to remember Statistics and Probability vocabulary words and their definitions? Do you need pictures and models of the most important Algebra One vocabulary for your students? These math vocabulary word cards are the perfect solution! You can print and laminate this Statistics and Probability Unit of vocabulary cards, and post them on your classroom bulletin boards for students to see all year round!Statistics and Probability vocabulary cards will help your students h
Subjects:
Grades:
8th - 10th
Types:
CCSS:
Also included in: Algebra 1 Word Wall BUNDLE Common Core Aligned
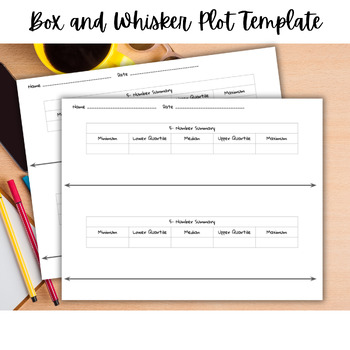
Box Plot Template | Box and Whisker Plot Template | Graphing Template
Box and Whisker Plot TemplateSay goodbye to data confusion and hello to organized insights with our Box Plot Template! This tool simplifies data organization with a five-number summary and a ready-to-use number line, so students can jump right into visualizing data distributions.With two box plots on one paper, students can easily compare data, spot outliers, identify medians, quartiles, and more - all at a glance!
Subjects:
Grades:
8th - 12th
CCSS:
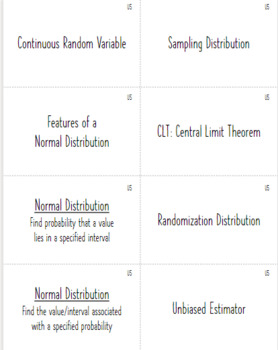
AP Statistics Unit 5 Flashcards - Probability - READY TO PRINT!
AP Statistics Unit 5 Flash Cards - Normal Distributions, Sampling Distributions for 1 and 2 proportions, 1 and 2 means, biased/unbiased statisticsHelp your students practice vocabulary terms and big ideas from Unit 5: Sampling Distributions for the AP Statistics Exam! These flash cards are ready to print double-sided on cardstock or paper. Concepts and terms are aligned with the current College Board Course and Exam Description for AP Statistics.
Subjects:
Grades:
9th - 12th, Higher Education
CCSS:
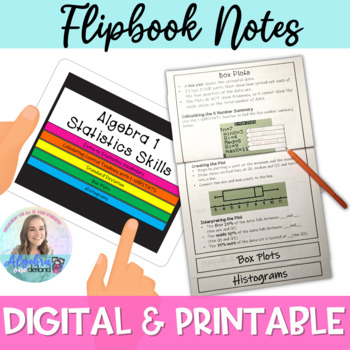
Statistics Notes Flipbook Digital and Printable for Algebra 1
This product contains flipbook notes for Introduction to Statistics in Algebra 1. There are FOUR VERSIONS included with LITTLE OR NO PREP, READY-TO-USE THIS MINUTE!Topics included:Vocabulary: frequency, symmetrical data, skewed data, distribution, variability, mean, median, mode, range, interquartile range, outlierCalculating Central Tendency: Using a TI-84 calculator to find the values in 1-VARSTATS.Standard Deviation: description, normal distribution curve and explanation, example of use. Box
Subjects:
Grades:
7th - 9th
Types:
CCSS:
Also included in: Algebra 1 Bundle of Notes and Study Guide Printable and Digital Flipbook
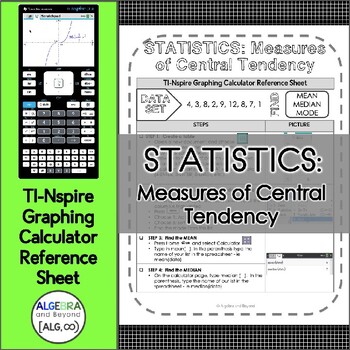
Statistics | Measures of Central Tendency | TI-Nspire Calculator Reference Sheet
This graphing calculator reference sheet on measures of central tendency guides students step-by-step on how to create a list and find the mean, median and mode.Teaching graphing calculator skills help students with: • Speed• Making connections• Checking for accuracy• Leaping hurdles*Reference sheet can be used with a TI-Nspire graphing calculator. Please look at the preview to find out more information about this resource∞∞∞∞∞∞∞∞∞∞∞∞∞∞∞∞∞∞∞∞∞∞∞∞∞∞∞∞∞∞∞∞∞∞∞∞∞∞∞∞∞∞∞∞∞∞∞© Algebra and Beyond This p
Subjects:
Grades:
10th - 12th
Types:
CCSS:
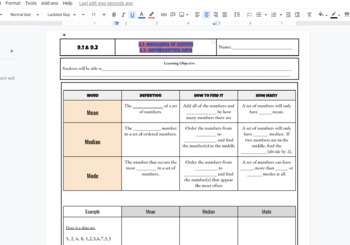
Mean, Median, Mode and Dot plot, bar graph histogram Fillable Notes Scaffolded
Central Tendencies: Mean, Median and Mode Fillable Notes Scaffolded used in math 1 classroom to introduce the data unit. Also includes dot plot, histogram and bar chart lesson. KEY IS INCLUDED!
Subjects:
Grades:
7th - 12th, Higher Education, Adult Education
CCSS:
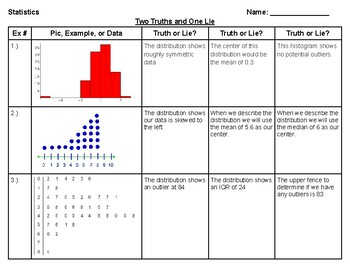
Two Truths and One Lie - Review 1.3 (Describing Quantitative Data with Numbers)
In this 15 minute activity each student or group must analyze each data display and discuss the three statements written about that display. Out of the three statements, two will be correct and one will be incorrect. This activity is a great "Error Analysis Activity" where the students must read and comprehend mistakes for each data display. High level of comprehension means our students can find the mistake and explain that mistake in each scenario instead of simply just choosing a correct
Subjects:
Grades:
7th - 12th
Types:
CCSS:
Showing 1-24 of 43 results

