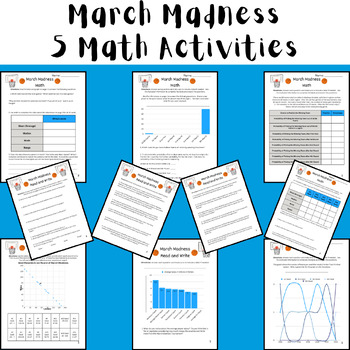
March Madness Men's Math - 5 Activities (Data + Graphs) Printable & Digital 2024
- PDF
- Internet Activities
Also included in
- This bundle currently contains 23 activities! Every time I add a resource, the price will go up! Make sure to purchase early so you can get muliple additional resources for free! Reading Comprehension, Writing, and Math Activities included!Current Activities:March Madness Crossword Puzzle - FREEBPrice $11.00Original Price $17.00Save $6.00
- This bundle includes 7 math activities. All of these activites are fun NO PREP math activities to do to celebrate March Madness! The activities can be completed as separate activities, stations, or as a multi-page packet. There is a fully customizable digital resource (Canva Template) and a printabPrice $2.50Original Price $3.00Save $0.50
Description
These 5 activities are fun NO PREP math activities to do to celebrate March Madness! The activities can be completed as 5 separate activities, stations, or as a multi-page packet. There is a fully customizable digital resource (Canva Template) and a printable resource (Canva) that contain the same directions and activity for each resource. This was designed for students in middle school, but could be used for upper elementary and high school students in Pre Algebra, Pre-Algebra, or Algebra.
In this assignment, students are asked to:
- Converting Fractions to Percentages
- Graph Points or Identify Points on a Graph
- Multi-Step Word Problems
- Written Response to Quantitative Data
- Analyzing Table Data
- Analyzing Line and Bar Graph Data
- Calculating Mean, Median, Mode, and Range
- Predicting Trends/Patterns in Data
- And More!
Looking for March Madness Activities? Try these!
- March Madness Growing Bundle - includes this activity!
- March Madness Crossword - FREEBIE
- Men's Teams - March Madness Pre-Selection Sunday Research Activity CER (Printable or Digital)
- Women's Teams - March Madness Pre-Selection Sunday Research Activity CER (Printable or Digital)
- March Madness Activity 2024 (Printable) Coloring Pages - FREEBIE
Looking for Leap Day Activities? Try these!
**Best-Selling Bundle - Leap Day 2024 Bundle - Math, Writing, and Reading Activities**
- Leap Year (Leap Day) 2024 True or False Trivia Activity - Printable OR Digital
- Leap Day 2024 Text Structures Activity (Multiple Passages and Questions)
- Leap Day 2024 - Author's Purpose CER Middle School (Printable or Digital)
- Leap Day (Leap Year) 2024 Alternative Options to a Leap Day - CER (Printable and Digital)
- Leap Year Coloring Pages - FREEBIE
- Leap Year (Leap Day) 2024 Activity - Crossword Puzzle - Printable - FREEBIE
Looking for St. Patrick's Day Activities? Try these!
- St. Patrick's Day - Writing Linear Equations in Slope Intercept Form Printable
- St. Patrick's Day Graphing Points (Coordinate Plane) - Printable - Pre Algebra
- St. Patrick's Day True or False Trivia - Printable or Digital Resource
- St. Patrick's Day Claim Evidence Reasoning (Data Analysis) Printable or Digital
- St. Patrick's Day Middle School Math Activity - Printable or Digital
- St. Patrick's Day (Middle School) Passage+Questions Activity - Printable
- St. Patrick's Day Crossword Puzzle - FREEBIE
- St. Patrick's Day Math Activities (Test Prep Data Analysis) Printable or Digital
- St Patrick's Day SEL Activities Craft Printable - FREEBIE
- St. Patrick's Day Coloring Pages Craft Printable- FREEBIE
- St Patrick's Day 2024 Text Structure and Writing Activity - Printable or Digital


