214 results
Statistics research for administrators
First Grade IEP Goal Bank {editable}
Included are 35 sample IEP goals for first graders that I wrote when I worked as a special education coordinator. If possible, the goal was aligned to the common core state standards. The file is in a Word document, so it is completely editable for your use.1st grade goals are broken up into the following categories: ✔ Reading comprehension✔ Listening comprehension✔ Fluency abilities✔ Decoding skills✔ Sight word recognition✔ Writing mechanics✔ Spelling✔ Writing content✔ Math computation/counting
Grades:
1st
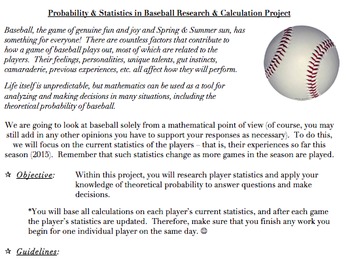
Probability & Statistics in Baseball Project (Common Core Aligned, AND FUN!)
The problems and activities within this document are designed to assist students in achieving the following standards: 6.SP.B.5, 7.SP.C, HSS.CP.A.2, HSS.CP.A.3, HSS.CP.B.7, HSS.CP.B.9, as well as the standards for mathematics practice and the literacy standards. They are also designed to help the teacher assess the students’ abilities when it comes to working with the ideas within the standards.This document contains the following:A project designed to allow students to investigate theoretical
Subjects:
Grades:
5th - 12th, Higher Education, Adult Education, Staff
SPED Coordinator Survival Kit
This is the most extensive product bundle I've created at TpT. It includes everything I think you'd need to begin work as a Special Education Coordinator at a school, particularly in New York State. All of the documents were either created by me while I was working as a SPED Coordinator (over 100 pages) or are awesome, free resources that I've located online (more than 300 pages) and included to make your life easier. All of my own resources are EDITABLE to fit your needs. Included in your purch
Grades:
Not Grade Specific
Suicide Prevention Presentation for Staff
With the increasing numbers of tragedies occurring in schools these days, it is so important to have a plan for how to educate staff on suicide prevention! This suicide prevention resource can be used both as an individual informational guide or as a school-wide staff presentation. It includes info on the suicide definitions, statistics, warning signs, and more! This is a 7 slide, interactive PDF resource.
Grades:
Staff
Also included in: School Counselor Presentation Bundle
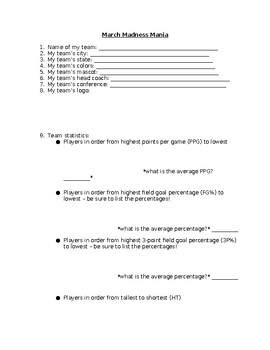
NCAA March Madness Basketball Tournament Team Research Statistics
Do you have students interested in the March Madness basketball tournament? Then this is the activity you need!To begin our March Madness unit, we look at all of the teams participating in the tournament and complete a map together to show where each team is from. We notice that some states have more than others and some states have none, and spend time discussing why that might be. Students will complete their own March Madness bracket.Students will then select a team in the NCAA March Madness
Grades:
4th - 9th
Types:

Education/Teaching/Science/Medicine/Motivation/Development Book Study BUNDLE
Book Study BUNDLEBooks/Research INCLUDING: EducationTeachingScienceMedicineMotivationDevelopment Learning Professional Development
Grades:
PreK - 12th, Higher Education, Adult Education, Staff
School/ Classroom Equitable Grading Policy
Tired of Grading Worksheets, Not Empowering Students? Imagine students grappling with real-world issues, their voices amplified by diverse texts and perspectives. They don't just learn about power dynamics, they analyze them, critique them, and imagine ways to change them. That's the transformative power of our revolutionary unit plan template with an exemplar unit, designed with you, the passionate educator, in mind. Forget dry facts and endless worksheets. Our template empowers you to create u
Grades:
6th - 12th, Staff

Scatter Plot and Bivariate Data Research Project
Students will begin a statistics project on one of their favorite restaurants or food chains! They will be researching nutrition facts and surveying others on what types of food they like to eat there. Through this data collection they will work on their skills of creating scatter plot graphs, creating relative frequency tables, and analyzing this data. This can be used either by paper or digitally. I used it the last two years during distance learning. Rubric included.
Subjects:
Grades:
7th - 12th
Types:
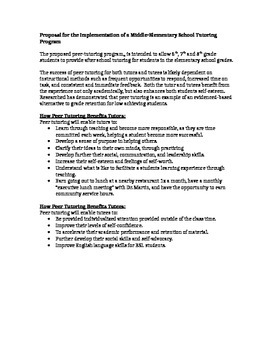
After School Tutoring Proposal and Implementation Forms
Boost academic performance and social emotional functioning through an after school tutoring program. This product includes:
- Researched-based benefits of a tutoring program (to both tutor and tutee)
- Application Form (tutor)
- Teacher Recommendation form (tutor)
- Tutor Agreement (including parent signature)
- Tutor Training guidelines
- Parent letter for potential tutees (from school)
- Tutee interview form (completed the first meeting)
- Tutor Feedback sheet (to provide reflection on thei
Grades:
K - 8th, Staff
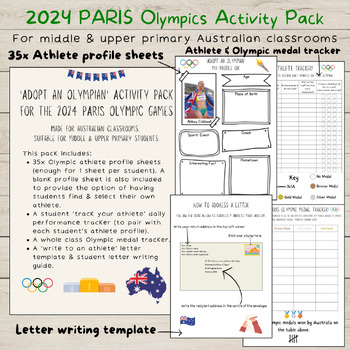
2024 PARIS Olympic Games Activity Pack | Middle & Upper Primary | Australia
Are you an Australian Teacher who is looking for a fun & engaging way to connect your students to the 2024 PARIS Olympic Games? This is the PERFECT resource for you! This activity pack provides students with the opportunity to:Research & profile an Australian Olympic athlete who has been selected to compete at the 2024 Paris Olympic Games.Individually track their athlete over the 19 days of the Olympic Games.Write a personal letter of support to their athlete, to be posted to them at the
Subjects:
Grades:
3rd - 6th
Types:
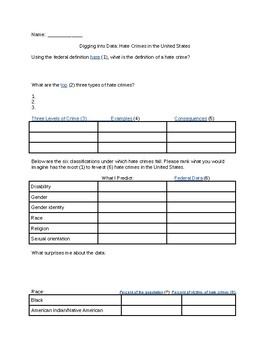
The 57 Bus- Looking at Hate Crime Data
A guided web search on hate crime data from the FBI, CDC, Pew Research Center, and U.S. Census Bureau. Uses reflection questions to make conclusions and predictions about the distribution of hate crimes. The kids are fascinated by the data!
Subjects:
Grades:
7th - 12th, Higher Education, Adult Education
Types:
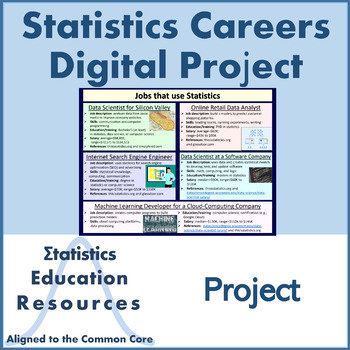
Careers in Statistics Digital Project
Distance Learning: Careers in Statistics Project Students complete this project by researching careers in statistics and creating a digital report. They select five careers and summarize their characteristics including job description, required skills (such as how statistics are used), education/training, and salary. Students may elect to create a digital poster (EDITABLE 24-inch by 18-inch template in PPTX included) or a short video report. Only want to assign a digital poster or only want vid
Subjects:
Grades:
9th - 12th
Types:
Also included in: Bundle: Algebra I Statistics Activities (Common Core Aligned)
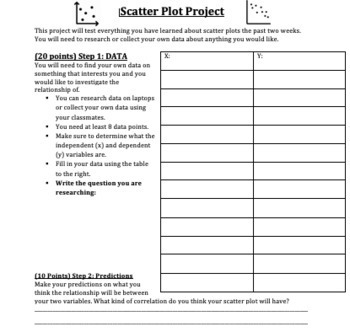
Scatter Plot Project
This is an awesome research project that is summative assessment for a Scatter Plot unit. For this project students are asked to pick a research question about bivariate data, gather the data online or through a survey. Next, they will make a prediction, construct a scatter plot, draw a line of best fit, find the equation of a line of best fit, and answer analytical questions about the data by interpreting the scatter plot. This is a great project that will allow students to utilize technology t
Subjects:
Grades:
7th - 10th
Types:
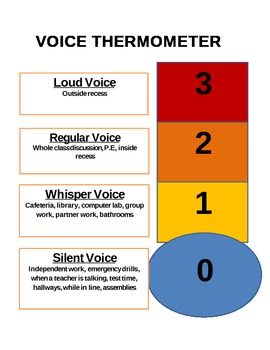
PBIS Voice Thermometer
A PBIS must have! The voice thermometer lets kids know what level voice is expected in all areas of school. Customize it to fit for your school. At my school, every teacher has the thermometer posted in their room. We all use the same thermometer language and all students know that voices are at a 0 in the halls. GREAT VISUAL TOOL!
Grades:
K - 8th
Types:
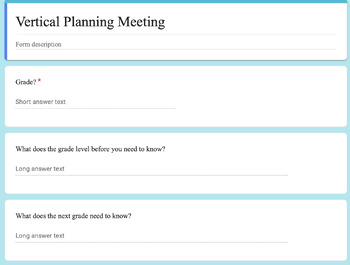
Vertical Planning Meeting Google Form
Planning for the next year? This tool can help identify areas of strengths and weaknesses. It can be used help teachers lead discussions on what they need to be more successful in the classroom.
Grades:
Not Grade Specific
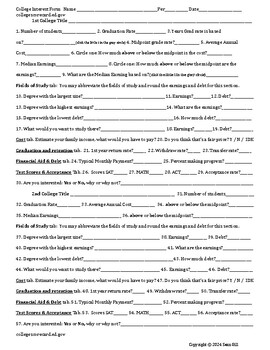
College Research Project Unit
This is an excellent unit on college research. If your school is college focused or you just need a interested based project to get the students engaged, this is a great way to get kids interested in colleges and their stats. Did you know that the federal government compiles all the FAFSA data? It keeps track of how much money each person who filled out a FAFSA makes over the long term (10 years+). There is a wealth of data on every college that has ever accepted federal funding and it is all at
Subjects:
Grades:
6th - 12th
Types:

Global Crisis Project (Exponential Functions)
The goal of the Global Crisis Project is to have students see and understand real applications for exponential functions. Students will do research on the population growth rate (globally or they may choose a specific location) and investigate the effect that a related global issue such as waste, food, disease, life"expectancy/mortality rate, poverty, inflation, national debt, etc. has on population. Students find accurate data points from reliable internet sources, and will use exponential reg
Subjects:
Grades:
9th - 12th
Also included in: Math in the Real World Projects Bundle

Statistics Research Project
This project can be done in an Algebra 1 class or in a beginning Statistics class.Through this project students will...- Create a two-question survey questionnaire (using Google Forms).- Conduct a survey that will produce quantitative data.- Interpret survey data, and use Desmos to generate the line of best fit.- Find the correlation coefficient and use these values determine how well the line of best fit models the data.- Generate a residual plot and use it to interpret data.- Find the sum of t
Subjects:
Grades:
8th - 12th
Also included in: Math in the Real World Projects Bundle
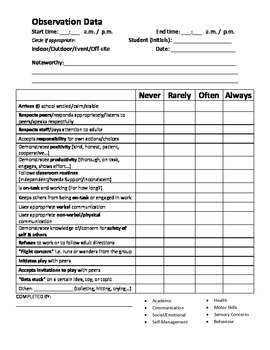
Elementary Student Observation Form
Free download.
Please see page 2 for directions and details.
This form can be used in two ways:
- To indicate WHICH behaviours/descriptions may apply to a student by asking their teacher to complete it ("check all that apply")
- To record details in real-time when observing a child to document behaviour (tally number of instances or write words in the chart to describe what you are seeing)
I hope this resource is useful to you!
Kim @ WAKwords
Grades:
PreK - 6th

Stock Investing 101
For high school (and savvy middle school) economics students, Stock Investing 101 is a great tool for students to explore stocks on the Stock Market. This worksheet can be easily edited by simply changing the companies that the students need to investigate in order for it to be used over and over again. Estimated time for student completion: 45-60 minutes
Subjects:
Grades:
7th - 12th
Types:
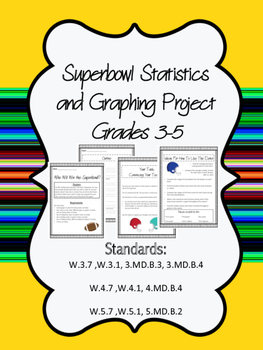
Superbowl Statistics, Graphing Project with Writing Prompt 3-5
****NEWLY UPDATED*****
This project has students selecting a team that will win the Superbowl, then using statistics from the season and graphing to PROVE their team will win. The document lists requirements, types of graphs and ideas for ways to show data with the team's season statistics. Teachers/students will need to go to the NFL website and research the statistics. Teachers could also print these off for teams to use.
The second half of the project has been added in support of CCSS. Stude

Crisis in Education - Teacher Shortages in America
Crisis in Education - Teacher Shortages in America High poverty and high minority schools tend to be lacking educators even more severely and at a greater disparity, which calls into question the equality of education and access for children. This insightful lesson reveals the gaps, struggles and failures of American education, which without swift governmental intervention will only worsen.To what extent are underqualified adults, staff, substitute teachers, teachers' assistants and administrato
Grades:
1st - 12th, Higher Education, Adult Education, Staff
Scatter Plot Project on Desmos with Template
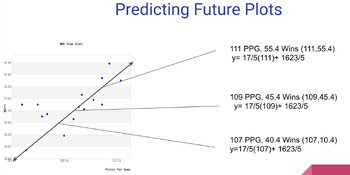
Learners will work to collect their own data from something they are interested in. They will then create a scatter plot using Desmos.com and analyze the information they collected. The analysis includes drawing their own trend line, finding the equation of that trend line, and predicting 3 values outside their original data collection. There are detailed directions with screenshots included along with a Google Slides template that can be shared with learners to help them organize their work. I
Subjects:
Grades:
7th - 9th
Types:

GRAY WOLF MATH PROJECT
Wolf. Wolves. Gray Wolf. Wildlife. Percent Applications. Threatened Species.Connect math to environmental science.Vilified by folklore and popular culture, there probably is no mammal in the world as misunderstood as the gray wolf. As a keystone species it is vital to maintaining a healthy ecosystem. It has largely been exterminated in the United States although recent conservation actions have seen a reintroduction of the gray wolf into Yellowstone National Park. Students will study habitat
Subjects:
Grades:
5th - 8th
Showing 1-24 of 214 results

