430+ results
Graphing resources for Microsoft Word and for homeschool
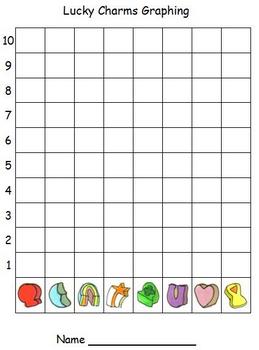
St. Patrick's Day Lucky Charms Math - Graphing and Addition
Celebrate St. Patrick's Day with these yummy math activities. Using Lucky Charms cereal, kindergarten and first grade students will sort, graph and add the "magically delicious" marshmallow shapes (the shapes included are the ones currently in circulation.)
Subjects:
Grades:
PreK - 1st
Types:
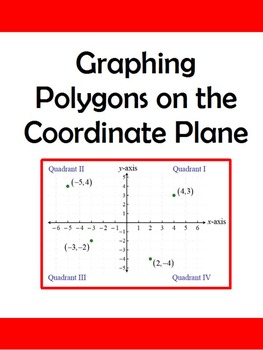
Graphing Polygons on the Coordinate Plane to Find Area/Perimeter
This activity asks the students to plot various ordered pairs on a coordinate plane and connect the points to make a polygon. Then they are expected to calculate the area and/or perimeter of each shape. The first worksheet has a square, two rectangles and a triangle. The triangle is starred to show higher level thinking. Each polygon is to be colored a different color. The second worksheet asks the students to plot the points of five polygons: a triangle, two rectangles and two composite f
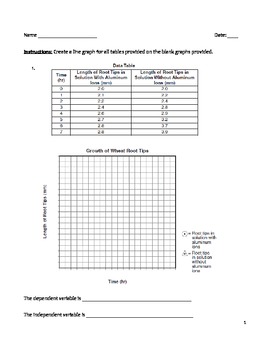
High School Science Graphing Worksheet - Making Line Graphs in Science
Use this worksheet to help your students practice making line graphs. In addition, they will have to identify both the independent and dependent variables. Hopefully, they will make the connection between the variables and their placement on the graph. There is a key provided for the teacher. There are ten line graphs for students to work with.
line graph, plot points, independent variable, dependent variable, data table, uniform scale, x-axis, y-axis
Subjects:
Grades:
8th - 12th
Types:
Blank Bar Graph/Double Bar Graph Template
This is a bar graph template that can be used by teachers to teach students how to understand bar graphs and create their own bar graphs. Teachers can use this template teach students about parts of a bar graph and how to interpret data in bar graphs.
Grades:
1st - 12th
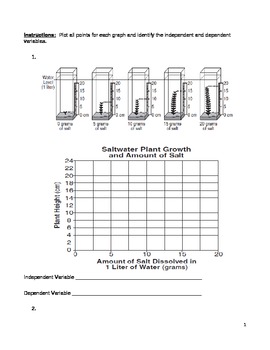
Middle School Math and Science Graphing Practice - Middle School Line Graphs
Use this resource to help your middle school math and science students learn and practice how to make line graphs as well as identify the independent and dependent variables. Move beyond bar graphs! There is a teacher key provided and eight graphs for practice.
line graph, plot points, x-axis, y-axis, independent variable, dependent variable
Subjects:
Grades:
5th - 9th
Types:
Create Population Pyramids!
OverviewStudents will understand how to read a population pyramid by creating one! This activity includes two templates to help your students create their own population pyramids, as well as population data for four countries from the U.S. Census Bureau's International Database. The activity includes blank cards if you or your students would like to create additional or specific population pyramids. Instructions are included to help navigate the U.S. Census Bureau's website in order to obtain th
Grades:
6th - 12th
Types:
Making Science Charts and Graphs
A simplified look at making charts and organizing data in science.
-Data Charts
-Circle Graphs
-Bar Graphs
-Line Graphs
-Key Vocabulary List
-Quiz/Assessment
-Activity - Practice
-Teacher answer key for quiz and activity
Thanks for taking the time to stop by my store!
Mrs. Degs
Teaching Science Well
Blog: http://teachingsciencewell.wordpress.com/
Facebook: https://www.facebook.com/TeachingScienceWell
TPT: http://www.teacherspayteachers.com/Store/Teaching-Science-Well-Science-Resources
Pi
Subjects:
Grades:
3rd - 10th
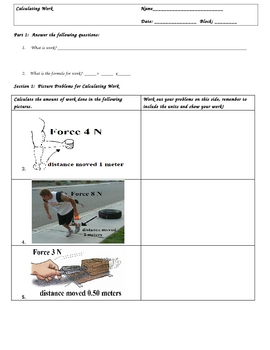
Calculating Work (W=Fxd) Worksheets and Key
Calculating Work (W=Fxd) Worksheets and KeyIf you have been teaching a Simple Machines or Energy Unit, then you need to check out this three page lesson to teach calculating work. It is in three sections.Section 1: Picture QuestionsSection 2: Word Problems/with Challenge QuestionsSection 3: Charting/Graphing ProblemsAll problems are worked out and the key is included.These worksheets include the renown Triangle Method, which has been a proven problem solver for students who struggle in math.The
Subjects:
Grades:
3rd - 12th, Higher Education, Adult Education
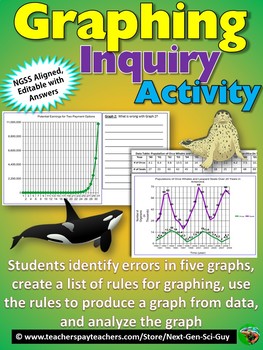
Graphing Inquiry Activity: NGSS Graphing and Data Analysis: Distance Learning
This activity proceeds as follows:1. Students are given a hypothetical scenario in which they are offered two different payment options for house-sitting a wealthy neighbor's house, and have to fill in a data table by calculating the earnings for each option 2. Students then evaluate five different graphs, each of which incorrectly represents the data in some way. They must find the mistakes.3. Students then generate a list of rules for proper graphing4. Students use their rules, and data on or
Grades:
7th - 12th
Types:
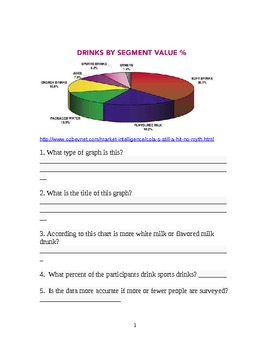
Charts and Graphs for Middle School
Included are thiry-eight graphs, charts, maps, flowcharts, tables and other graphics. These are real data maps taken from the Internet (all sources noted). Under each graphic are five questions that can be answered by using the information provided. The questions range from titles, mean, meadian, to create your own graph.
The pages can be copied back to back to make a workbook. I use this workbook as bellwork while I am taking attendance. Everyday the students answer the question. (I requi
Subjects:
Grades:
6th - 9th
Types:
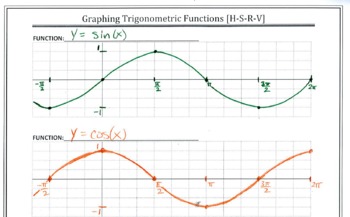
Graph Paper for Trig Functions
This changes everything! Student work becomes more consistent. Your grading will be so much easier! Using the four aligned graphs makes translations of trig functions crystal clear. This file has 2 pages of coordinate planes for graphing trig functions.The first page contains four blank graphs per page. The axes are unlabeled so that students may select their own scale.The second page has five blank graphs per page and is set up for conducting transformations on the coordinate plane.Please see
Subjects:
Grades:
10th - 12th, Higher Education, Adult Education
Interpreting Graphs and Charts
Students work with a variety of 25 graphs and charts and learn how to interpret the information provided. The format varies from one to the other: pie, column bar, horizontal bar, line/dot, and picture (volcano) graphs and table charts. Appropriate for math, Social Studies, ELA, ESL, and Spanish culture. Can be used in Gr. 6-12, adult education, college, and home school. All answer keys provided.
Grades:
6th - 11th, Higher Education, Adult Education
Types:
St. Patrick's Day - Pattern Block Shamrock
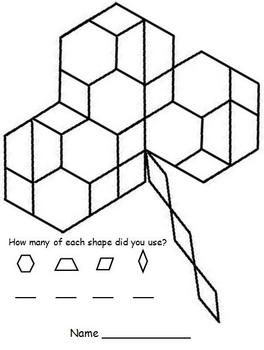
Kindergarten and first grade students can practice their counting skills and knowledge of shapes and they use this template to make a pattern block shamrock. After they construct their shamrocks, they count and record how many of each shape they used. A great math lesson for St. Patrick's Day!
Grades:
PreK - 1st
Types:
Kinematics Motion Graph Matching Card Game
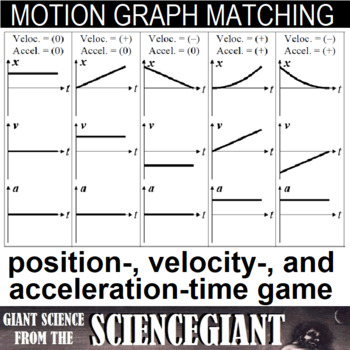
Motion Graph Matching Card GameMake a game of reviewing motion graphs, and challenge students to find all four matching sets of position-, velocity-, and acceleration-time graph cards and data descriptions. The product contains 28 cards – seven sets of four different card types. Each set covers a motion example and the associated motion graph for an object moving along a straight line in one dimension with its basic shape and slopes. HOW TO PLAY: Cards are placed face down. Students randomly sel
Subjects:
Grades:
7th - 12th
Types:
Also included in: StayGiant Physics Bundle: Kinematics
End of the Year Ice Cream Glyph
Students will follow directions to complete their ice cream glyph. When they are finished, have students display their glyph in a central location, such as on a bulletin board or in a hallway. Next, students will complete the "Reading the End of the Year Ice Cream Glyph" page. They will use the information from the whole class's glyphs to complete their pages. It's more fun if the students' names are on the back of their ice cream glyph, so students can guess whose is whose. Afterwards, they can
Subjects:
Grades:
2nd - 5th
Types:
Constructing Graphs - Bar Graphs, Line Graphs, Circle Graphs
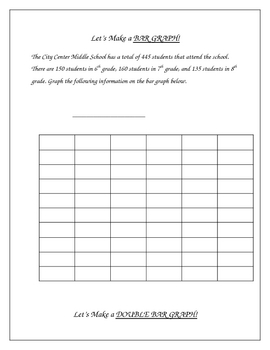
**I revised the numbers in the pie graph on this from the first version, these amounts are much more friendly** This activity includes construction of a bar graph, double bar graph, line graph, double line graph, and a circle graph.I put this together after being frustrated about not being able to find any graphing activities appropriate for intermediate grades that would allow me to make graphs with the class on my smartboard. I needed some examples to demonstrate how to take data and create a
Subjects:
Grades:
3rd - 10th, Adult Education
Types:
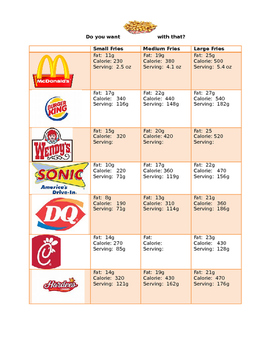
French Fry Scatter Plot & Best Line of Fit
Students will compare the nutritional values and serving sizes of french fries from various fast food restaurants. Based on this information, they will create scatter plots, best lines of fit and the equation of the trend line. Using the equation, they will estimate the unknown values of kid meals and supersized portions of french fries.
Subjects:
Grades:
8th - 11th
Types:
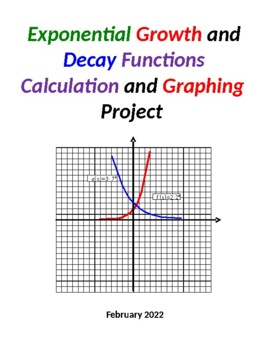
Exponential Growth & Decay Functions Calculation & Graphing Project
PLEASE NOTE: THE PREVIEW VERSION OF THIS PRODUCT IS THE ACTUAL "STUDENT VERSION" AND DOES NOT INCLUDE ANY OF THE ANSWERS TO THE PROBLEMS. THE "PRODUCT VERSION" INCLUDES DETAILED ANSWERS TO ALL OF THE PROBLEMS FOR THE PROJECT.This activity involves the calculation, graphing and coloring of exponential growth and decay functions. I have my Algebra 1/Math 1/Math 2 students complete this project toward the end of the unit on exponential functions.A total of five (5) exponential growth functions a
Subjects:
Grades:
8th - 10th
CCSS:
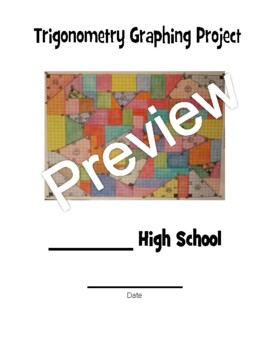
Trigonometry Graphing Project
The purpose of this project is to give your students a deeper understanding of the use of trigonometry in analyzing various types of triangles. It will also provide them with an interesting and colorful way to display various triangles and their properties and dimensions in a single area so that they can see the difference in the type and shape of these triangles. The project requires the students to use the 3 basic trig functions (sine, cosine and tangent) and their inverses as well as the La
Subjects:
Grades:
9th - 11th
CCSS:
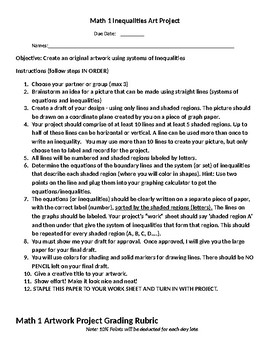
Algebra 1 Systems of Linear Inequalities Art Project
This project allows students to practice graphing systems of linear inequalities to create a picture made up of shaded areas. Includeds detailed directions and a grading rubric. I provided my students with graph paper to do their draft on, then large poster size grid paper to do their final project. Students worked in groups of 2 to 4.
Subjects:
Grades:
8th - 11th
Types:
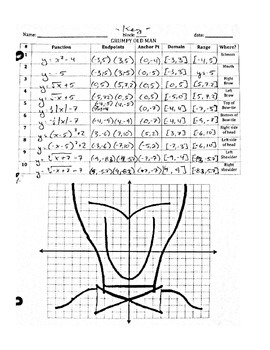
Function Transformation: Grumpy Old Man
Students must create functions based off commands. When they are graphed together (on paper and on a graphing calculator) they create an image of a grumpy old man. I use this activity before I have the students create their own image on Desmos.com. They say it is really helpful for them.
Practices:
- Function transformation with linear, absolute value, quadratic, square root, cubic, and cubed root functions.
- Finding domain and range.
- Finding key/anchor points.
- Graphing with restricted
Subjects:
Grades:
10th - 12th
Types:
CCSS:
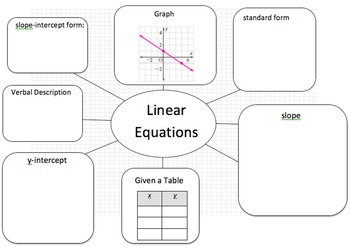
Linear Equation Web - Translate Between Linear Representations
This activity is an organized way to have students translate between various representations of a linear function (COMMON CORE F8.2; F8.3 and ALGEBRA 1 Standards). The idea plays on the outline web used to plan a five paragraph essay. I have used this as individual assignments, but the most effective strategy is to work in small groups or centers. The students have a great time helping each other if made into a game with prizes! I have included a blank web for you to be creative! Sometimes, I ha
Grades:
7th - 10th
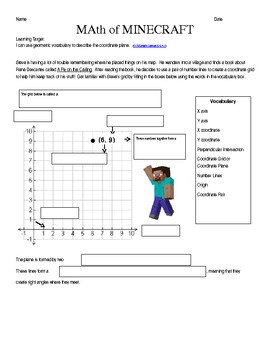
Math of Minecraft 5th Grade CC aligned Geometry
This activity/printable was developed around the game of Minecraft. Students use geometric vocabulary to describe the coordinate plane then plot and label points in the context of the game. This activity is aligned to 5th grade Common Core Geometry standards (5.G.A.1,2). Students will enjoy making a connection between this math skill and a game that is relevant to so many students in their age range. The real game includes maps that have X, Y and Z coordinates so this is a great real-world a
Grades:
3rd - 6th
Types:
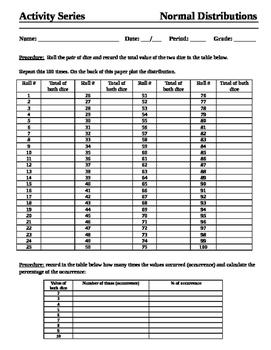
Normal Distributions - Activity Series
This activity sheet helps students better understand normal distributions through the use of dice. Each student rolls a pair of dice and adds the total of each dice and records it 100 times. Then they plot the distribution and in most cases it comes out a bell curve. Its a fun and easy way to show the distribution. You could pair students up for less dice usage.
Subjects:
Grades:
10th - 12th
Types:
Showing 1-24 of 430+ results


