🎉 Teacher Appreciation: Save up to 25% using promo code THANKYOU24. Sale ends in 12 hrs 4 min. Learn more
10,519 results
Middle school statistics resources
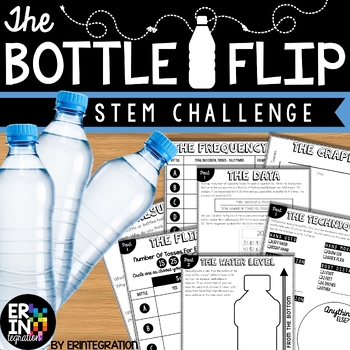
Water Bottle Flip STEM Challenge + STEM Activity
The ORIGINAL water bottle flip STEM activity and lab! Water bottle flip at school? Absolutely! Students will love this on-trend STEM challenge inspired by the popular YouTube water bottle flipping challenge where students toss a water bottle and attempt to land it straight up. Practice scientific method with some probability, fractions and data collection in the mix while having fun!This self-paced, low-prep, project based learning water bottle flip STEM challenge is print-and-go. Each activit
Subjects:
Grades:
3rd - 6th
Types:
CCSS:
NGSS:
K-2-ETS1-2
, K-2-ETS1-3
, MS-ETS1-2
, K-2-ETS1-1
, 3-5-ETS1-3
...
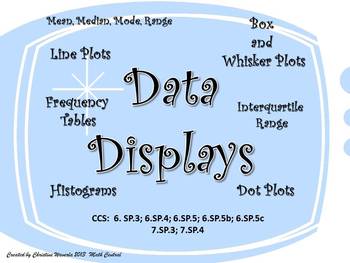
Data Displays: Line Plots, Histograms, Box and Whisker Plots, Frequency Tables
This is one of my favorite teaching tools! I created this Data Display set of worksheets this year for my 6th grade class. My students loved using these worksheets to practice their new skills. Each worksheet provides plenty of room for students to create their data displays and answer questions based on the data. Questions ask students to find the mean, median, mode, range, interquartile range, and percentages.These worksheets are fully aligned with the Common Core Curriculum.CCS: 6.SP.3; 6.SP
Subjects:
Grades:
6th - 8th
Types:
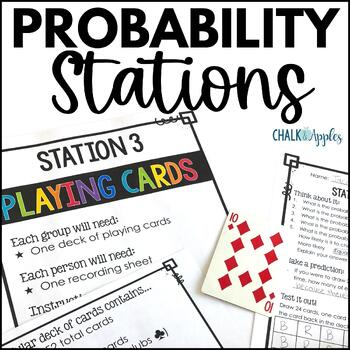
Chance & Probability Activities: Hands-On Theoretical & Experimental Probability
Make teaching probability exciting with these hands-on fun probability activities! This set includes 6 low-prep chance and probability stations perfect for exploring theoretical and experimental probability and critical thinking. Quick and easy setup plus clear student directions make these activities perfect for centers or substitute days, too!Lead your students to discover concepts of probability by exploring it on their own before teaching probability rules. Students will love exploring proba
Subjects:
Grades:
5th - 7th
Types:
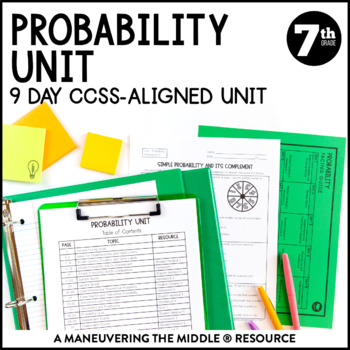
Probability Unit | Independent and Dependent Events | 7th Grade Math Notes
A 9 day CCSS-Aligned Probability Unit - including simple probability, experimental and theoretical probability, making predictions, and independent and dependent probability.Students will practice with both skill-based problems, real-world application questions, and error analysis to support higher level thinking skills. You can reach your students and teach the standards without all of the prep and stress of creating materials!Standards: 7.SP.5, 7.SP.6, 7.SP.7, 7.SP.8; Texas Teacher? Grab the T
Subjects:
Grades:
7th
Types:
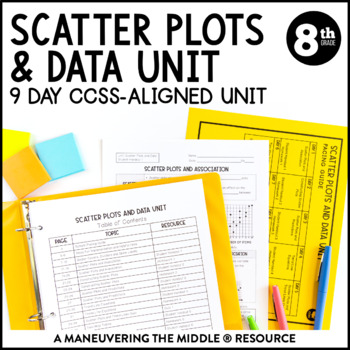
Scatter Plots and Data Unit | 8th Grade Math | Line of Best Fit Notes
A 9 day CCSS-Aligned Scatter Plots and Data Unit - including scatter plots, trend lines, two-way tables and relative frequency.Students will practice with both skill-based problems, real-world application questions, and error analysis to support higher level thinking skills. You can reach your students and teach the standards without all of the prep and stress of creating materials!Standards: 8.SP.1, 8.SP.2, 8.SP.3, 8.SP.4; Texas Teacher? Grab the TEKS-Aligned Scatter Plots and Data Unit. Please
Subjects:
Grades:
8th
Types:
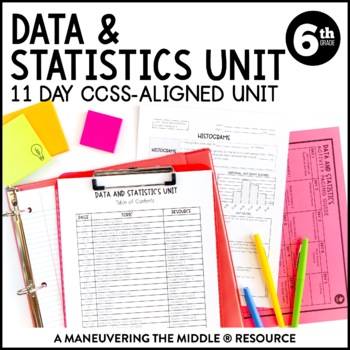
Data & Statistics Unit | Measures of Center, Dot and Box Plots, & Histograms
An 11 day CCSS-Aligned Statistics Unit - including statistical questions, describing data, and analyzing data with dot plots, box plots, and histograms. Students will understand measures of center and variability and how they relate to displays of data. Students will practice with both skill-based problems, real-world application questions, and error analysis to support higher level thinking skills. You can reach your students and teach the standards without all of the prep and stress of creatin
Subjects:
Grades:
6th
Types:
Mean, Median, Mode & Range Whodunnit Activity - Printable & Digital Game Options
Nothing like a good criminal investigation to liven up mean, median, mode, and range! Based off my popular CSI projects, I have created Whodunnits? The Whodunnits plan to focus on single content topics as opposed to units and will focus more on skill building than application. Every day can't be a project day, so Whodunnits can be an engaging out of their seat activity to practice important skills. In a Whodunnit?, students will work in teams to solve 10 practice problems that increase in diffic
Subjects:
Grades:
6th - 12th
Types:
Also included in: Pre-Algebra Whodunnit Activity Bundle - Printable & Digital Game Options
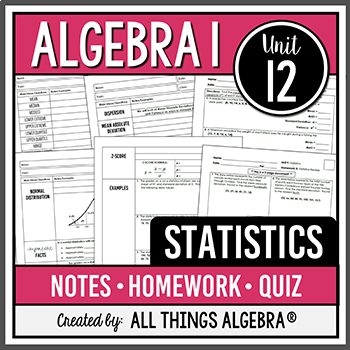
Statistics (Algebra 1 Curriculum - Unit 12) | All Things Algebra®
This Statistics Unit Bundle contains guided notes, homework, and a quiz that cover the following topics:Mean, median, mode, range, lower extreme, lower quartile, upper quartile, upper extreme, interquartile range, box-and-whisker plots, stem-and-leaf plots, histograms, mean absolute deviation, standard deviation, variance, normal distribution, and z-scores.ADDITIONAL COMPONENTS INCLUDED:(1) Links to Instructional Videos: Links to videos of each lesson in the unit are included. Videos were create
Subjects:
Grades:
8th - 11th
Types:
Also included in: Algebra 1 Curriculum | All Things Algebra®
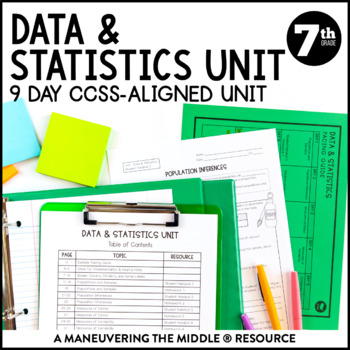
Data and Statistics Unit | Random Sampling, Dot Plot, & Box Plot 7th Grade Notes
A 9 day CCSS-Aligned Statistics Unit - including populations and samples, drawing inferences from samples, measures of centers and variability, comparing and analyzing dot and box plots. Students will practice with both skill-based problems, real-world application questions, and error analysis to support higher level thinking skills. You can reach your students and teach the standards without all of the prep and stress of creating materials!Standards: 7.SP.1, 7.SP.2, 7.SP.3, 7.SP.4; Texas Teache
Subjects:
Grades:
7th
Types:
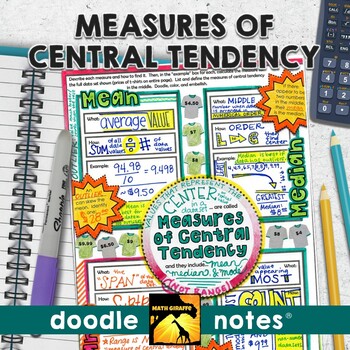
Measures of Central Tendency Doodle Notes (Mean, Median, Mode, & Range)
Mean, Median, Mode, and Range (Measures of Central Tendency): "doodle notes" - visual note taking pages with interactive tasks for building stronger retention of measures of center (mean, median, mode, and range) for your middle school statistics unit in Pre-AlgebraBoost your students' focus and memory! The blend of graphic and linguistic input in these guided visual notes helps students' brains to convert the information to long-term memory more easily.When students color or doodle in math clas
Subjects:
Grades:
6th - 8th
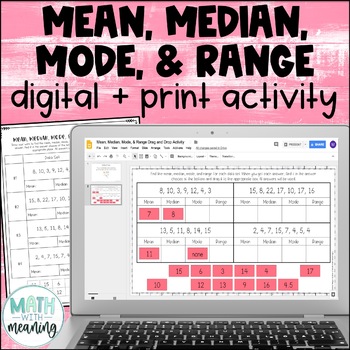
Mean, Median, Mode, & Range Digital and Print Activity for Google Drive
Looking for a fun, no-prep activity for finding mean, median, mode, and range? Students will find the mean, median, mode, and range for 4 data sets. They will then then find their answer from the answer choices at the bottom and drag it to the appropriate spot. Each data set contains 6-8 numbers. Please view the preview file to make sure that this activity is appropriate for your students.This product includes the following:A link to the digital activity on Google Slides including student direct
Subjects:
Grades:
5th - 8th
CCSS:
Also included in: Middle School Math Digital and Print Activity Bundle Volume 1
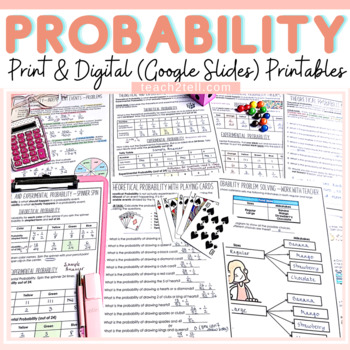
Chance and Probability Activities Print and Digital Worksheets |Google Classroom
Are you teaching your students all about chance and probability and looking for fun hands-on probability activities? This print and digital (google slides) bundle of probability worksheets will reinforce the understanding of theoretical probability, experimental probability, language of chance, sample space, predictions, lists, tree diagrams, dependent probability events and independent probability events.Both US and British English spelling and terminology included.Overview of Activities1. The
Subjects:
Grades:
4th - 8th
Types:
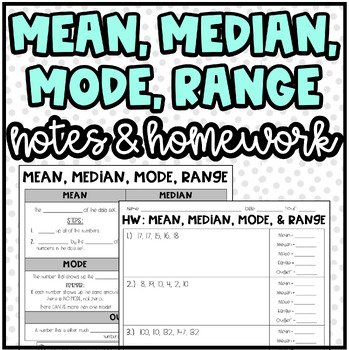
Mean, Median, Mode, Range, and Outlier | Notes and Homework or Practice
Notes & Homework: Mean, Median, Mode, Range, and Outlier:I used these notes, practice, and homework with my students. I used this lesson to serve as a "quick lesson" for the students. It covers how to find the mean, median, mode, range, and outlier.Product Includes:Notes Page with 2 examplesNotes Page Answer KeyHomework (10 organized problems with workspace provided)Homework Answer KeyThank You! ❤️I really appreciate your interest in my product! I love to create new things for my students! A
Subjects:
Grades:
5th - 8th
6th Grade Statistics Project: Analyzing Zombie Virus with Dot Plots and Mean
I created this project as a way for my 6th graders to practice their statistical skills. They loved it! They get to pretend to be epidemiologists studying a virus outbreak that is turning people into zombies. It's a fantastic way for students to see how statistics is used in the "real world" - they were also very interested to learn about the field of epidemiology. The Project: Students are given data about infected people who are quarantined in an airport. They are also given two maps of the US
Subjects:
Grades:
5th - 7th
Types:
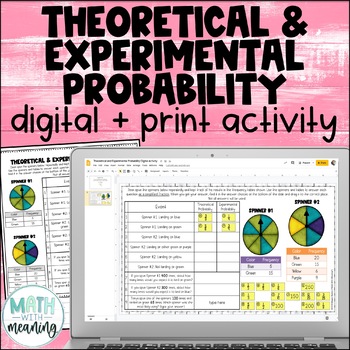
Theoretical and Experimental Probability Digital and Print Activity
Looking for an engaging, no-prep activity to practice working with theoretical and experimental probability? Students will use two sets of spinners and frequency tables to answer questions in this fun digital and print activity.This activity requires students to find the theoretical and experimental probabilities of simple events and to use theoretical probabilities to make predictions. Please view the preview file to make sure that this activity is appropriate for your students.This product inc
Subjects:
Grades:
5th - 8th
CCSS:
Also included in: Middle School Math Digital and Print Activity Bundle Volume 3
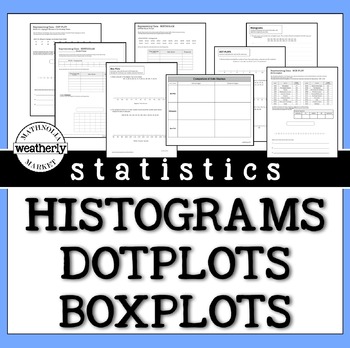
STATISTICS - Histograms, Dot Plots and Box Plots
There is no need to scour the internet for data. This resource includes the data and the format to challenge your students' skills with data displays.This packet includes worksheets that provide opportunities for students to create histograms, dot plots, and box plots.They can be used as guided practice or as "on your own" activities.INCLUDES3 worksheets with realistic data.3 worksheets with REAL data (Apple stock prices, US Olympic athlete ages, and the Oscars:Best Picture/ Movie Times)AND 3 wo
Subjects:
Grades:
6th - 9th
Types:
CCSS:
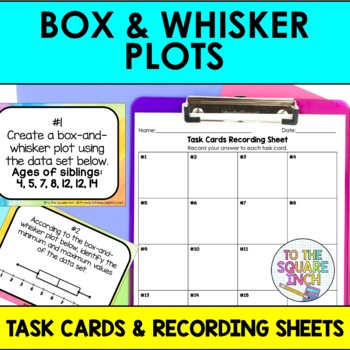
Box and Whisker Plot Task Cards Activity | Box and Whisker Math Center Practice
Boost your students' understanding of box and whisker plots with this engaging task card activity. This low-prep set includes 20 task cards that are perfect for reinforcing all concepts of area of composite shapes. With minimal prep required, your students will practice and build these skills in a fun, engaging and out-of-their seat activity perfect for supplementing any lesson. These cards can quickly be set up for a variety of different activities that will make for a more dynamic learning e
Subjects:
Grades:
5th - 8th
Types:
CCSS:
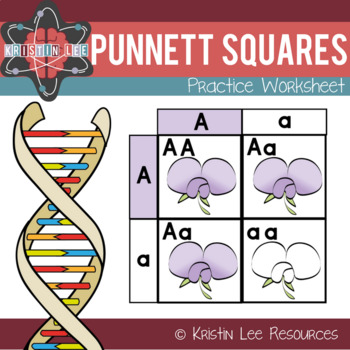
Punnett Squares Practice Worksheet
This is a worksheet I used with my 7th graders during a Genetics unit. We had just gone over probability and Punnett Squares. This was the first practice that they had to do on their own. Background knowledge required. The worksheet consists of filling in Punnett squares and using them to determine the probabilities of different traits. There are 5 problems and 2 conclusion questions.This worksheet also comes with the bundle "Probability in Genetics PPT w/ Notes and Punnett Worksheet" if you
Subjects:
Grades:
6th - 8th
Types:
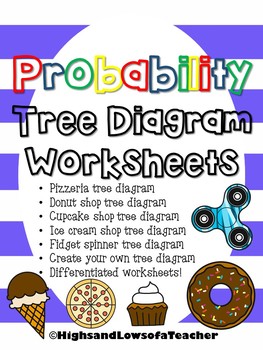
Probability Tree Diagram Worksheets
Use these tree diagram worksheets to help students learn all the outcomes (combinations) for probability unit.What's included-*Pizza toppings probability tree diagram*Donut probability tree diagram*Cupcake probability tree diagram*Ice cream probability tree diagram*Fidget spinner probability tree diagram*Create your own tree diagramAll worksheets come differentiated---one page that has tree diagram drawn in with some combinations already filled-one with tree diagrams drawn in-one blank page only
Subjects:
Grades:
3rd - 8th
Types:
Also included in: Probability Activity BUNDLE
Mean Median and Mode Math Mystery Game Activity - 6th Grade Math Edition
Mean, Median, and Mode Review Activity - 6th Grade Edition: The Case of Mean Mountain. Engage and motivate your students with this fun math mystery activity! Great for practice and review! Now available with printable and digital worksheets! Easy prep! Just Print the worksheets & Solve! Or go paperless with the new Google Slides option provided within your download.--------------------------------------------------------------------------------------------⭐Optional video hook included for i
Subjects:
Grades:
5th - 8th
Types:
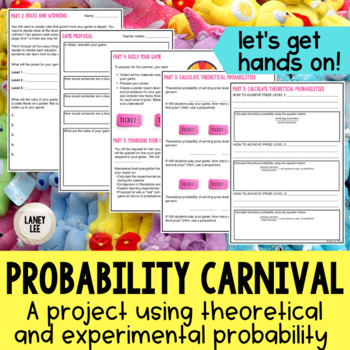
Probability Carnival Game Project - PDF & Digital
Looking for a fun, hands on way to bring probability to life? Are you ready to move past the "sit and get" style of whole group instruction? If you answered yes to either of those questions, then this resource is for you!Keep your students engaged and accountable with the interactive, versatile Probability Carnival! The steps of this project are designed to be rigorous and require students to predict, reflect, connect, and think critically about the situations being investigated.Using this proje
Subjects:
Grades:
6th - 8th
Types:
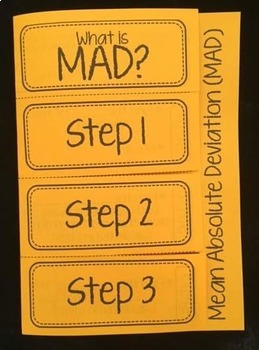
Mean Absolute Deviation MAD Foldable Notes
This editable foldable provides an introduction to Mean Absolute Deviation (MAD). Students will take notes on the meaning of MAD, the steps for finding MAD, and complete 1 example.This works great whole group/ guided instruction, in math centers, as a class work/ homework assignment, or even as an exit slip. Perfect for interactive math notebooks!Now with two options and an editable PowerPoint version!This product is also included in the following bundles:★ 6th Grade Math Foldable + Activity B
Subjects:
Grades:
6th - 7th
Types:
CCSS:
Also included in: Data Analysis and Statistics Foldable Bundle
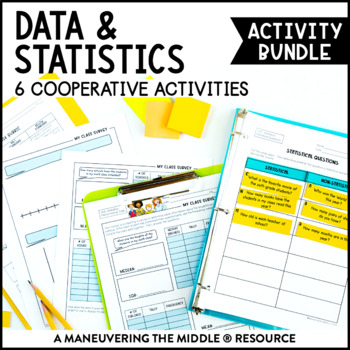
Data & Statistics Activity Bundle | Measures of Center, Histograms, & Box Plots
This Data and Statistics Activity Bundle includes 6 classroom activities to support statistical questions, histograms, box plots, measures of center and measures of variability. These hands-on and engaging activities are all easy to prep! Students are able to practice and apply concepts with these data and statistics activities, while collaborating and having fun! Math can be fun and interactive! Standards: CCSS (6.SP.1, 6.SP.2, 6.SP.3, 6.SP.4, 6.SP.5) and TEKS (6.12A, 6.12B, 6.12C, 6.12D, 6.13
Subjects:
Grades:
5th - 7th
Types:
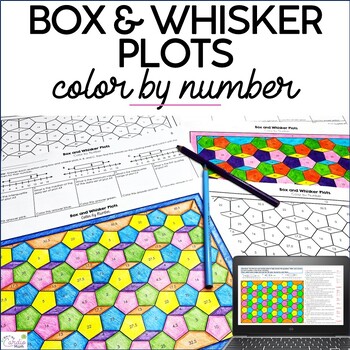
Box and Whisker Plots Color by Number Activity 6th Grade Math Worksheets
This box and whisker plots color by number activity includes two print and one digital version, offering engaging and versatile practice, while adding the mindfulness, wellness, and quietness coloring brings.Coloring in math has been shown to help reluctant students feel more comfortable with math:-)The box and whisker plot problems require students to identify:First quartile MedianThird quartile Interquartile rangeRange MinimumMaximum Number that would be in each quartile, based on a number of
Subjects:
Grades:
6th - 7th
Types:
Showing 1-24 of 10,519 results


