21 results
Middle school statistics teacher manuals
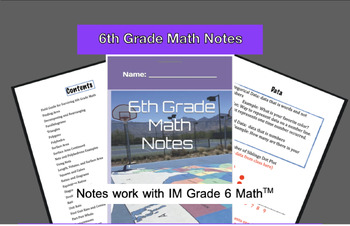
IM Grade 6 MathTM Guided Math Notes and Teacher Version
Here are all the notes needed for 6th grade math. This product included the student and teach version of the notes. This resource is based on the IM K-12 MathTM authored by Illustrative Mathematics® and offered under a CC BY 4.0 License.
Subjects:
Grades:
6th
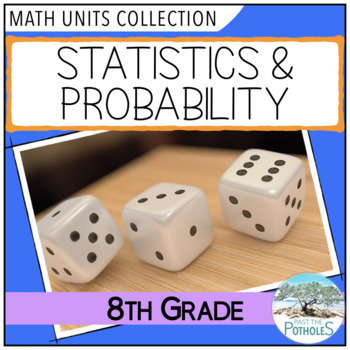
8th Grade Math: Statistics & Probability Linear Relations Frequency Tables Slope
This middle school math unit for Statistics and Probability (data management) includes detailed Google 3-part lesson plans, projectable lesson slides, activities, and assessments that correspond to the Common Core Math curriculum for 8th grade. This unit is part of our ENTIRE YEAR OF COMMON CORE MATH PACKAGE which includes all of our math resources for Grade 8th Grade."This unit is excellent! It provides simple to use lessons that cover Statistics and Probability and align to the common core sta
Subjects:
Grades:
7th - 9th
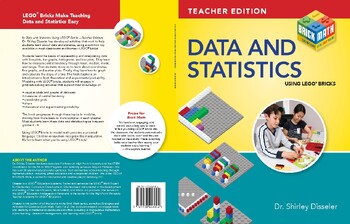
Data and Statistics: Teacher Edition
In Data and Statistics Using LEGO® Bricks—Teacher Edition, Dr. Shirley Disseler has developed activities that work to help students learn about data and statistics, using a common toy available in most classrooms and homes—LEGO® bricks! Students learn the basics of representing and interpreting data with line plots, bar graphs, histograms, and box plots. They learn how to measure central tendency through mean, median, mode, and range. Then students move on to learn about coordinates, line graphs
Subjects:
Grades:
5th - 8th
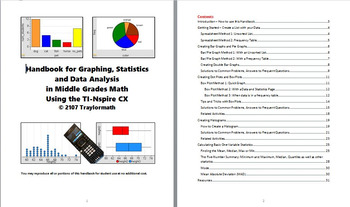
Graphing, Statistics & Data Analysis in Middle Grades Using TI-Nspire
This 30-page handbook ties together everything you need to use TI-Spire technology to teach middle school level data graphing and statistics. It will show you, step-by-step, how to create bar graphs, pie graphs, dot plot, box plots and histograms, and several methods for finding mean and quartiles, as well as an easy way to calculate Mean Absolute Deviation (MAD) with TI-Nspire. It also answers all those student questions about "why doesn't my graph look right?" Developed though several years of
Subjects:
Grades:
5th - 9th, Staff
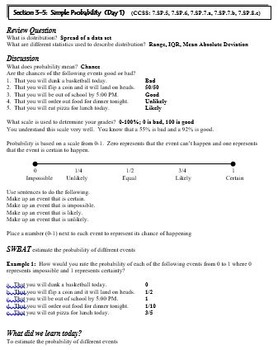
Statistics and Probability: Simple, Theoretical, Experimental, Probability
This is a 7 day lesson plan (powerpoint and hard copy) covering the topics of simple, theoretical, and experimental probability. Each lesson includes a review question, discussion, problems for teacher to model, and problems for the students to try. The lesson plan includes days of instruction, days of practice, assignments, and activities.
Subjects:
Grades:
7th - 9th
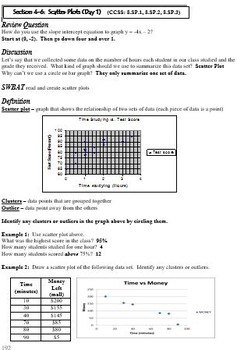
Statistics and Probability: Scatter Plots and Best Fit Lines
This is a 9 day lesson plan (powerpoint and hard copy) covering the topics of scatter plots and best fit lines. Each lesson includes a review question, discussion, problems for teacher to model, and problems for the students to try. The lesson plan includes days of instruction, days of practice, assignments, activities, and a project.
Subjects:
Grades:
7th - 9th
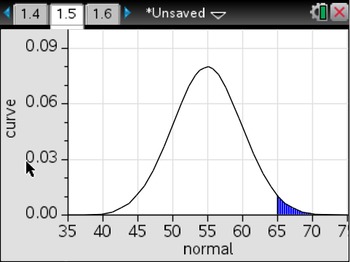
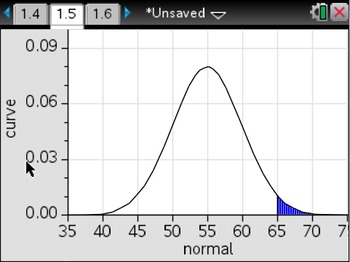
Normal Curve PDF: TI-NSpire Calculator Steps
This NSpire Calculator unit is designed for math department chairs, specialists, coaches, administrators, lead teachers, and classroom teachers. It contains ESSENTIAL information you need to cover Virginia SOL A.9 and AII.11 (Z-Scores, Standard Deviation, Normal Curve, Empirical Rule) properly.
Please enjoy. If you have any questions or comments, please do not hesitate to contact me at rturner31@gmail.com. I appreciate your feedback! Thanks for your purchase.
Subjects:
Grades:
7th - 12th
Types:
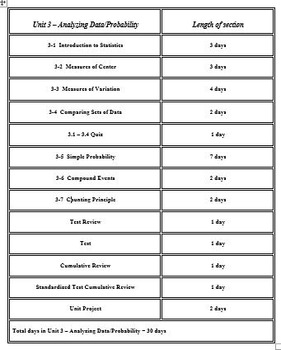
Statistics and Probability: 7th Grade CCSS Stats and Probability Unit
These materials include a complete student and teacher manual that cover all of the CCSS for 7th grade Statistics and Probability. These materials include multiple day lessons for each topic. Powerpoint presentations accompany all of the multiple day lessons. These materials also include assessments. These materials will provide you with complete lessons that will engage your students. You will have zero prep time while using these materials.
Subjects:
Grades:
7th
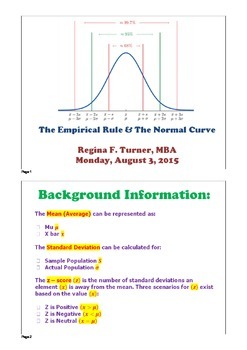
Z-Scores, Standard Deviation, Empirical Rule: PDF
This NON-calculator unit is designed for math department chairs, specialists, coaches, administrators, lead teachers, and classroom teachers. It contains IMPORTANT information you need to cover Virginia SOL A.9 and AII.11 (Z-Scores, Standard Deviation, Normal Curve, Empirical Rule) properly.
Please enjoy. If you have any questions or comments, please do not hesitate to contact me at rturner31@gmail.com. I appreciate your feedback! Thanks for your purchase.
Subjects:
Grades:
7th - 12th
Types:
Z-Scores, Standard Deviation, Empirical Rule: Flipchart
This NON-calculator unit is designed for math department chairs, specialists, coaches, administrators, lead teachers, and classroom teachers. It contains IMPORTANT information you need to cover Virginia SOL A.9 and AII.11 (Z-Scores, Standard Deviation, Normal Curve, Empirical Rule) properly.
Please enjoy. If you have any questions or comments, please do not hesitate to contact me at rturner31@gmail.com. I appreciate your feedback! Thanks for your purchase.
Subjects:
Grades:
7th - 12th
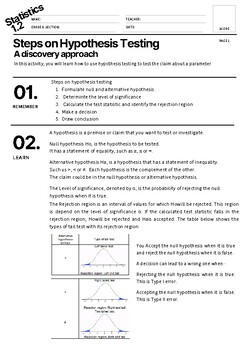
Statistics Steps on Hypothesis Testing Discovery Approach
Having difficulty in teaching the steps on hypothesis testing?Does your student still confuse on the basic steps on hypothesis testing?Grab this Lecture- Activity -Quiz all in one all about steps on hypothesis testing.This includes, all the important points to remember. Easy to understand and student's learn it by discovering the meaning and concept by following this activity all through out.You don't need to teach long and keep on repeating for students who have difficulty in math.This includes
Subjects:
Grades:
8th - 12th, Higher Education, Adult Education
Central Tendency Notes - Mean, Median, Mode, Range, and Outlier
These notes on central tendency (mean, median, mode, range, and outlier) are a great way to introduce the analysis of number sets! I have included examples for you to teach, or you can simply print out these notes for your students to have.
Subjects:
Grades:
6th - 9th
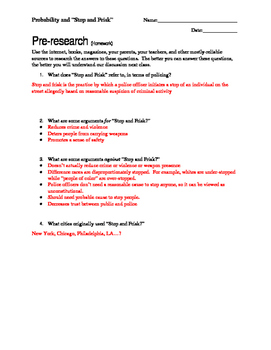
Using Probability to Teach Social Justice Answers
This is the answer key to the Stop and Frisk experiment/activity that can be found in my store.
Subjects:
Grades:
8th - 12th
Types:

Fruit Fly Colony Biology Lab #AtHome
A fruit fly colony #athome? Yes, easy, fun, and flies won't invade your home. Drosophila are easy to capture, maintain, and use for experiments from genetics and developmental biology to biochemistry and animal behavior. Labs4Home has you covered as we roll out new hands-on wet-labs that can be done #athome with common household materials.Labs4Home introductory fruit fly lesson teaches you how to start a fruit fly colony #athome using ingredients you have on the shelf already. Once you have
Subjects:
Grades:
8th - 12th, Higher Education, Adult Education
CCSS:
NGSS:
MS-LS1-5
, MS-LS1-7
, MS-ETS1-2
, MS-LS2-1
, HS-LS2-1
...
Also included in: Labs4Home Biology Labs Bundle
Beginning Teachers Kit - Weeks 1 and 2
This Kit is a booklet filled with ideas and activities that you can do with your class in the first two weeks of school. It has instructions as well as planning sheets to go with the instructions. I also have resources for daily five, subject labels and duty labels. All of these visuals will help you in your first two weeks. This kit can also be used if you have never taught a certain age group before...enjjoy.
Subjects:
Grades:
4th - 8th
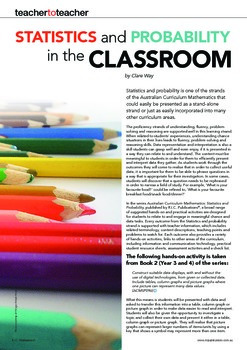
Australian Curriculum Mathematics: Statistics and Probability.
Statistics and probability is one of the strands of the Australian Curriculum Mathematics that could easily be presented as a stand-alone strand or just as easily incorporated into many other curriculum areas.
The proficiency strands of understanding, fluency, problem solving and reasoning are supported well in this learning strand. When related to students' experiences, understanding chance situations in their lives leads to fluency, problem-solving and reasoning skills. Data representation an
Subjects:
Grades:
PreK - 7th
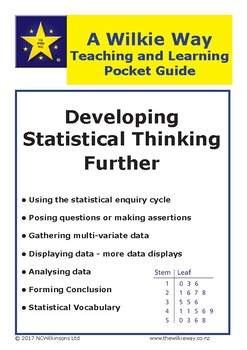
Wilkie Way Pocket Guide To Further Developing Statistical Thinking
A guide to the essentials for further developing statistical thinking. Dealing with numeric data displays and multi variate data.
The statistics for students in the upper primary and lower secondary years.
Download onto your phone or tablet and have a quick guide at your fingertips.
Subjects:
Grades:
4th - 7th

Regression Modeling and Equation Solving on TI-83/84
This product includes 2 handouts that I use with my algebra 1 classes to teach the used of TI-82 through TI-84 calculators.
The first handout (3-pages) walks students through the process of creating regression equations.
The second handout (3-pages) walks students through the process of solving equations using the calculator by the graphing method.
As I modify my algebra course to match the common core and the PARCC assessments, I am finding that the graphing calculator is an essential elemen
Subjects:
Grades:
8th - 11th
Types:
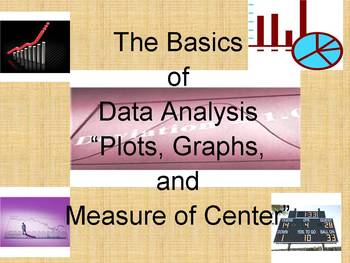
The Basics of Data Analysis
This teacher guide will assist the teacher and your students with the basics of plots and graphs related to data analysis. Measures of center will also be discussed. Everywhere one looks we see numbers and data. From our height and weight measurements at the doctor’s office to weighing bananas at the produce department scale, we are constantly bombarded with numbers. Trying to find a meaning from this information can become a monumental task. A branch of mathematics called “statistics” tries
Grades:
4th - 12th, Higher Education, Adult Education
Types:
Math About {ANYTHING} Planning Sheet: Using Authentic Data in the Math Classroom
Engage your students in collecting and analyzing authentic data about any topic. This planner will help you plan a lesson to connect math to any topic that engages you and your students. Social studies collaborative project? Survey about pop music? Get to know you activity? Your choice! For more information about how I use this template and how to adapt it to your class, check out my blog post: Math About {Anything} LessonsMore math activities using authentic student data Designed with adult l
Subjects:
Grades:
7th - 12th, Higher Education, Adult Education
Translation Code
As part of our NSF-funded passion-driven statistics project, we have just started to share more widely our “translation code” aimed at supporting folks in learning code-based software and in moving more easily between them. The pdf includes all of the basic syntax for managing, displaying and analyzing data, translated across SAS, R, Python, Stata and SPSS. http://bit.ly/PDSTranslationCode.For more information about our warm and welcoming data-driven curriculum, check out https://passiondrivenst
Grades:
6th - 12th, Higher Education, Adult Education
Types:
Showing 1-21 of 21 results


