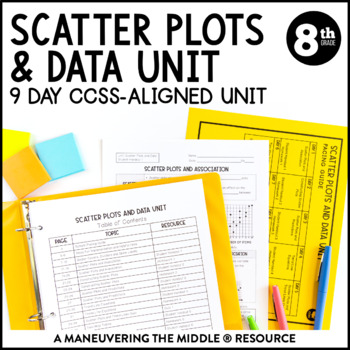
Scatter Plots and Data Unit | 8th Grade Math | Line of Best Fit Notes
- Zip
- Google Apps™

What educators are saying
Description
A 9 day CCSS-Aligned Scatter Plots and Data Unit - including scatter plots, trend lines, two-way tables and relative frequency.
Students will practice with both skill-based problems, real-world application questions, and error analysis to support higher level thinking skills. You can reach your students and teach the standards without all of the prep and stress of creating materials!
Standards: 8.SP.1, 8.SP.2, 8.SP.3, 8.SP.4; Texas Teacher? Grab the TEKS-Aligned Scatter Plots and Data Unit. Please don’t purchase both as there is overlapping content.
Learning Focus:
- construct and interpret scatter plots
- use trend line equations to make predictions
- display data in two-way tables and calculate relative frequencies
More details on what is included:
1. Unit Overviews
- Streamline planning with unit overviews that include essential questions, big ideas, vertical alignment, vocabulary, and common misconceptions.
- A pacing guide and tips for teaching each topic are included to help you be more efficient in your planning.
2. Student Handouts
- Student-friendly guided notes are scaffolded to support student learning.
- Available as a PDF and the student handouts/homework/study guides have been converted to Google Slides™ for your convenience.
3. Independent Practice
- Daily homework is aligned directly to the student handouts and is versatile for both in class or at home practice.
4. Assessments
- 1-2 quizzes, a unit study guide, and a unit test allow you to easily assess and meet the needs of your students.
- The Unit Test is available as an editable PPT, so that you can modify and adjust questions as needed.
5. Answer Keys
- All answer keys are included.
***Please download a preview to see sample pages and more information.***
How to use this resource:
- Use as a whole group, guided notes setting
- Use in a small group, math workshop setting
- Chunk each student handout to incorporate whole group instruction, small group practice, and independent practice.
- Incorporate our Scatter Plots and Data Activity Bundle for hands-on activities as additional and engaging practice opportunities.
Time to Complete:
- Each student handout is designed for a single class period. However, feel free to review the problems and select specific ones to meet your student needs. There are multiple problems to practice the same concepts, so you can adjust as needed.
Is this resource editable?
- The unit test is editable with Microsoft PPT. The remainder of the file is a PDF and not editable.
Looking for hands-on classroom activities?
- Check out the corresponding Scatter Plots and Data Activity Bundle, which includes activities like scavenger hunts, find it and fix its, mazes and more to allow students to engage and practice the concepts. Win-win!
More 8th Grade Units:
Unit 2: Exponents and Scientific Notation
Unit 10: Volume
Unit 11: Scatter Plots and Data
More 8th Grade Activity Bundles:
Unit 2: Exponents and Scientific Notation
Unit 10: Volume
Unit 11: Scatter Plots and Data
Looking for more helpful teaching tips, ideas, and support? Check out Maneuveringthemiddle.com and join our online FB community MTM VIPS!
Try out a FREE math resource! Grab your freebie here!
Licensing:
This file is a license for ONE teacher and their students. Please purchase the appropriate number of licenses if you plan to use this resource with your team. Thank you!
Customer Service:
If you have any questions, please feel free to reach out for assistance. We aim to provide quality resources to help teachers and students alike, so contact me before leaving feedback if you have a need.
Maneuvering the Middle® Terms of Use
Products by Maneuvering the Middle®, LLC may be used by the purchaser for their classroom use only. This is a single classroom license only. All rights reserved. Resources may only be posted online in an LMS such as Google Classroom, Canvas, or Schoology. Students should be the only ones able to access the resources. It is a copyright violation to upload the files to school/district servers or shared Google Drives. See more information on our terms of use here.
If you are interested in a personalized quote for campus and district licenses, please click here.
©Maneuvering the Middle® LLC, 2012-present


