🎉 Teacher Appreciation: Save up to 25% using promo code THANKYOU24. Sale ends in 3 hrs 49 min. Learn more

2,137 results
4th grade statistics resources


Water Bottle Flip STEM Challenge + STEM Activity
The ORIGINAL water bottle flip STEM activity and lab! Water bottle flip at school? Absolutely! Students will love this on-trend STEM challenge inspired by the popular YouTube water bottle flipping challenge where students toss a water bottle and attempt to land it straight up. Practice scientific method with some probability, fractions and data collection in the mix while having fun!This self-paced, low-prep, project based learning water bottle flip STEM challenge is print-and-go. Each activit
Subjects:
Grades:
3rd - 6th
Types:
CCSS:
NGSS:
K-2-ETS1-2
, K-2-ETS1-3
, MS-ETS1-2
, K-2-ETS1-1
, 3-5-ETS1-3
...

Stem and Leaf Plot Notes and Worksheets
Show your students that a stem-and-leaf plot is actually a pretty easy and fun (yes, fun!) way to organize data with these worksheets and notes based on animals' life spans. On these two worksheets, students write the data from a graph and then create a graph based on a set of data. Notes about interpreting a stem and leaf plot are included!Can I modify this for my learners?Yes! Modified versions of the worksheets are included. An extension is also included for your early finishers (students
Subjects:
Grades:
4th - 7th
Types:
Also included in: Stem and Leaf Plot Bundle

Probability Activities - Fun Review Worksheets, Spinners, Dice, Task Cards
These low prep probability activities and worksheets make a great introduction or review. Students will practice probability vocabulary - certain, impossible, possible, likely, unlikely, and equally likely - and apply these words in a variety of situations and events. Students will also get the opportunity to think about different probability events with hands on practice using spinners, coins, and dice. The fun probability activities include: 6 anchor charts / probability posters to help stu
Subjects:
Grades:
2nd - 5th
Types:

Chance and Probability Activities Print and Digital Worksheets |Google Classroom
Are you teaching your students all about chance and probability and looking for fun hands-on probability activities? This print and digital (google slides) bundle of probability worksheets will reinforce the understanding of theoretical probability, experimental probability, language of chance, sample space, predictions, lists, tree diagrams, dependent probability events and independent probability events.Both US and British English spelling and terminology included.Overview of Activities1. The
Subjects:
Grades:
4th - 8th
Types:

Probability Tree Diagram Worksheets
Use these tree diagram worksheets to help students learn all the outcomes (combinations) for probability unit.What's included-*Pizza toppings probability tree diagram*Donut probability tree diagram*Cupcake probability tree diagram*Ice cream probability tree diagram*Fidget spinner probability tree diagram*Create your own tree diagramAll worksheets come differentiated---one page that has tree diagram drawn in with some combinations already filled-one with tree diagrams drawn in-one blank page only
Subjects:
Grades:
3rd - 8th
Types:
Also included in: Probability Activity BUNDLE

Probability Task Cards Math Review
Probability Task Cards help students practice probability in a fun way. Use these task cards for various activities or math centers to teach/review probability skills such as compound events, likelihood of an event, combinations., and MORE! Use for Scoot, small groups, centers, or whatever else you can think of!This set of 32 cards covers skills such as:**determining the probability of an event**stating whether an event is certain, impossible, least likely, most likely, or equally likely**comp
Subjects:
Grades:
3rd - 6th
Types:
Also included in: Math Task Card Bundle

Mean, Median, Mode, Range Math Doodle Wheel | Notes and Practice Activity
Use this mean, median, mode, range doodle math wheel for notes and practice. Introduce each data measurement type as you teach it, or, you can use the math wheel to review all of them at once.What is a math wheel? A math wheel is a type of graphic organizer where students can:Take notes/guided notes inside the math wheelUse color, drawing, and doodling to help create memory triggersComplete practice problems in the pattern around the wheel, andColor the background patternStudents can keep these
Subjects:
Grades:
4th - 6th
Also included in: Mean, Median, Mode, Range Activity Bundle Math Centers

Data and Graphing Project - Real World Math Project Based Learning Activities
This data and graphing project gives your students a meaningful way to apply their data and graphing skills. Use this real world math project as an end of unit activity, enrichment activity or assessment. Easy to use and fun for students!Click the PREVIEW button above to see everything that is included in this fun math project!⭐ This resource includes:teacher information, directions and sample schedulesupply listgrading rubricstudent direction sheettwo data collection sheets (one for open ended
Subjects:
Grades:
4th - 6th
Types:
CCSS:

Simple Probability Activity: Escape Room Math Breakout Game
This breakout escape room is a fun way for students to test their skills with probability. Important: (How to Make Completely Digital)This product normally requires the printing of the questions to accompany a digital form for students to input answers. But if you follow a couple simple steps, this can be made entirely digital! Just use the following tool:https://smallpdf.com/split-pdf(choose "extract pages")to extract the pages containing the questions into its own PDF. You can then upload t
Subjects:
Grades:
4th - 6th
Types:

Blow Cup STEM Challenge and Scientific Method Project
The Blow Cup Challenge is now a STEM activity with this engaging science project inspired by the viral video where students try to blow one cup into another cup. Great low-prep way to teach the scientific method, variables and review math skills!This self-paced, multi-part Blow Cup STEM challenge is print-and-go. Each activity sheet guides students through the project. STEM Challenge Overview:Students will use the included visual directions, graphic organizers, charts, and activities to...Deter
Subjects:
Grades:
3rd - 6th
Types:
NGSS:
MS-PS2-2

Grade 5 Ontario Math - Probability Curriculum - Digital Google Slides+Form
Are you planning for the NEW Grade 5 Ontario Math Curriculum? This fully editable, NO PREP Google Slide resource is what you need! This resource is for the DATA strand and covers all specific expectations for “D2. Probability”. In this resource, students will experience math through engaging real-life questions, storytelling through math, and interactive slides. For teachers who are given Nelson© Math by your board, this resource loosely follows the order of the Probability chapter (Chapter 13)
Subjects:
Grades:
4th - 6th
Also included in: Grade 5 NEW Ontario Math Curriculum Full Year Digital Slides Bundle

Graphing and Data Analysis Task Cards {Interpreting Graphs and Tables}
Graphing and Data Analysis Task Cards: This set of 40 task cards (with 160 questions total) is designed to help students learn or practice how to read, analyze, and interpret data presented in tables and various forms of graphs. You may use these task cards for individual work, pair/group activity, whole class discussion, or in math centers. NOTE: For a full-page version of these task cards (with exactly the same problems/questions), click this link: Graphing and Data Analysis (Poster Size Task
Subjects:
Grades:
4th - 6th
Types:
Also included in: Math Task Cards SUPER BUNDLE

Skittles Candy with Mean, Median, Mode, Range, and Box and Whiskers Plot
This is a quick, fun activity to use with statistics. I have the kids bring in a pack of skittles and sort by color. Then all of the kids will find the Mean, Median, Mode, Range, and Box and Whiskers.
Subjects:
Grades:
4th - 8th
Types:

Create Your Own Survey: Collect, Organize, Graph, and Analyze Data
One of my best-selling TPT products -- now updated with a fresh look and new content!Teach Data Analysis the open-ended and engaging way -- through student-directed surveys!This resource pack is designed to help students follow the process of creating a survey: they will brainstorm questions, collect data, organize their obtained data, create multiple graphs to show their data, and then reflect on and analyze what their data tells them.The survey pack includes the following:Brainstorming Survey
Subjects:
Grades:
2nd - 5th
Types:

Dot Plot Worksheets
Students will read and create dot plots with these four worksheets. Students get experience interpreting data from dot plots as well as using vocabulary such as an outlier.
Two worksheets are reading a dot plot.
Two worksheets are creating dot plots from frequency tables including using a class survey of hours of sleep for data.
Answer key included for pages.
If you like this product, please rate me! I appreciate your feedback.
More math items can be found at my store, Always Love Learning.
Subjects:
Grades:
3rd - 6th
Types:

Chance and Probability Activities Theoretical & Experimental Probability Bundle
Are you teaching your students all about chance and probability and looking for fun hands-on probability activities? This print and digital bundle of worksheets, task cards, slideshows and note-taking sheets on Probability will reinforce the understanding of theoretical probability, experimental probability, language of chance, sample space, predictions, lists, tree diagrams, dependent probability events and independent probability events.Both US and British English spelling and terminology file
Subjects:
Grades:
4th - 7th

Probability Task Cards (Digital)
Probability is one of my favorite math topics to teach! These digital probability task cards make a great review activity for math centers, warmups, early finishers, and more. You can use this set during your probability unit or save it for an end-of-year test review.To complete the task cards, students move objects on the screen and type answers to questions. They'll complete everything directly in Google Slides. No prep for you; no lost papers for them!Students will:use probability vocabulary
Subjects:
Grades:
4th - 5th
Types:
CCSS:

Statistics Mean, Median, Mode & Range Interactive PowerPoint by Erica
Introduce statistics including mean, median, mode and range with this colorful, interactive 22 slide PowerPoint. This interactive PowerPoint introduces each term and teaches a strategy for finding the value. There is also a trick or visual to help students remember the steps to find each one (mean, median, mode and range). Students are able to practice finding the mean, median, mode and range and then check within the PowerPoint. This is excellent for a statistics lesson or for students to e
Subjects:
Grades:
3rd - 6th

Graphing Posters & Interactive Notebook Bar Graph Picture Graph Line Plot
This poster or anchor chart and interactive notebook (INB) set includes FOURTEEN posters covering bar graphs, double bar graph, pictographs, picture graph, line graphs, double line graph, line plot, circle graphs, frequency tables, sector graph, stem and leaf plots, histograms, dot plots, parts of a graph and box and whisker plots. This set also includes SIX different foldable interactive notebook (INB) pages (that you print and put into a paper notebook) for students to take notes as well as a
Subjects:
Grades:
2nd - 5th

Grade 5 NEW Ontario Math Data Literacy Unit Digital Slides
This resource includes a comprehensive and engaging Grade 5 Ontario Math Data Literacy Unit including 3-part lessons, skill practice, self-grading assessment, and social emotional learning. This unit covers EVERY SPECIFIC Expectation from the 2020 Ontario D1. Data Literacy Strand. WHY BUY THIS PRODUCT OVER OTHERS?My vision for teaching math is always "Don't just tell the story, let the students experience the story first hand. HOW?Students will be walked through curriculum concepts step-by-step
Subjects:
Grades:
4th - 6th
Types:

BAR GRAPHS: CLASS SURVEYS ACTIVITIES
BAR GRAPHS: SURVEYSThis Bar Graphs Class Surveys collection features collecting, graphing and interpreting data on topics your students will relate to. This is perfect for a getting-to-know-you back to school activity, or alternatively for applying graphing skills in real life situations.⭐ Separate folders featuring both British English and American spellings and terminology included.►What’s Included✅ 12 Class Surveys on topics of interest.✅ Choice of three Cover Sheets if compiling student su
Subjects:
Grades:
3rd - 6th
Types:
CCSS:

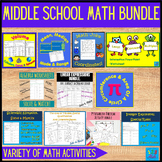
4 Pi Day Math Activities | Math & Art Projects | Coloring Circles | Pie Chart
4 Math & Art Projects to celebrate Pi Day that include circles and Pi exploration! Your students will love these Pi Day activities! Let your students express themselves using these hands-on Math & Art resources during the exploration of Pi.Content:- Your version of a piece of π (pie). The first 100 digits of Pi. Frequency Pie Chart.- Pi Bar Graph - the circular version.- The spiral of a piece of Pi.- Cut the Pi pie.This resource includes:- The editable PowerPoint™ version.- The printable
Subjects:
Grades:
4th - 8th

Skittles Chance and Probability (Editable)
Chance and Probability activity using yummy Skittles!!!
Students are to predict the colours and quantities before they open the skittles bag. Students are to complete a chance experiment where they use a tally to collect their data. Students then transfer their data in fractions, decimals and percentages. Students are to create a bar graph using their data as well as answer chance and probability questions about the data. I used this with my grade 5/6 students and they loved it!
Subjects:
Grades:
3rd - 10th
Types:

Statistics Graphing and Probability Interactive Math Unit | Grade 4/5
Stop searching for your statistics and graphing lessons. Everything you need to teach, practice, and assess bar graphs, pictographs, double graphs, stem and leaf plots and probability is included in this print-and-use unit. Your planning for your graphing unit is already done for you!This unit is part of the Full Year Interactive Math Unit Bundle for Grade 4/5. It comes with a bonus sequencing guide to help plan your whole year.This convenient resource includes:instructions for how to set up, as
Subjects:
Grades:
3rd - 5th
Showing 1-24 of 2,137 results

TPT is the largest marketplace for PreK-12 resources, powered by a community of educators.
IXL family of brands