171 results
Graphing resources for Microsoft Word $5-10

Beaker Pong: Experimental Design and Graphing Lab, NGSS aligned
Great 1st week or 1st month STEM activity! All parts are EDITABLE and includes a graphing grid! This is a great way to introduce the "science process" (better phrase for scientific method) at the start of a semester or anytime you want fun to occur in your classroom.*****Focus on the NGSS PRACTICES Dimension*****The National Research Council's (NRC) Framework describes a vision of what it means to be proficient in science; it rests on a view of science as both a body of knowledge and an evidenc
Subjects:
Grades:
7th - 12th
Types:
Coordinate Plane Amusement Park Project
This 11-page project packet is designed for students to create a "blue print" of their own amusement park. Packet also includes 3 pages of teacher directions/tips and a checklist. This is a culminating unit project to be used at the end of a unit on integers/graphing in the coordinate plane. By following the steps in each of five tasks, students create an amusement park using all four quadrants of the coordinate plane. Students demonstrate understanding of plotting points on the coordinate pl
Grades:
6th - 7th
Types:
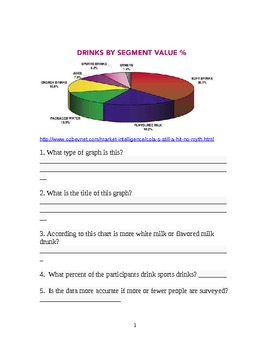
Charts and Graphs for Middle School
Included are thiry-eight graphs, charts, maps, flowcharts, tables and other graphics. These are real data maps taken from the Internet (all sources noted). Under each graphic are five questions that can be answered by using the information provided. The questions range from titles, mean, meadian, to create your own graph.
The pages can be copied back to back to make a workbook. I use this workbook as bellwork while I am taking attendance. Everyday the students answer the question. (I requi
Subjects:
Grades:
6th - 9th
Types:
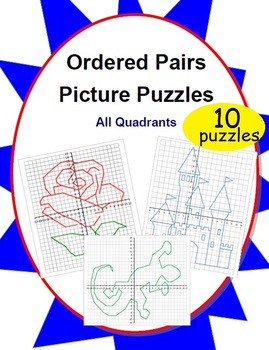
10 Ordered Pairs Mystery Picture Puzzles (All Quadrants)
10 original pictures perfect for any order pair puzzler. Start simple with a continuous connect-the-dot picture and graduate to more complex pictures composed of multiple sections. The built-in self-checking nature of creating a picture makes it easy for students to immediately assess their own progress.This 15-page PDF file includes:- 10 reproduction-ready original picture puzzles- An illustrated key so teachers can select appropriate puzzles based on student skill level and intended use- Numbe
Grades:
4th - 10th
Types:
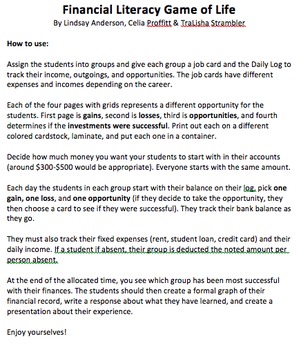
Financial Literacy Game of Life
Students put their financial literacy skills to use in this game of life. Each group is assigned a job with a salary, fixed and variable expenses, opportunities for investment, gains, and losses. Students track their bank balance throughout and on a daily log. It gives students a realistic insight into managing family resources and they enjoy the game and competition aspect of the activity.
(Note: I suggest you start them with a Day One starting balance of $200).
Subjects:
Grades:
3rd - 6th
Types:
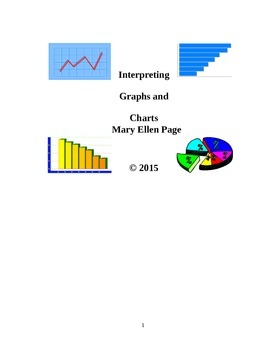
Interpreting Graphs and Charts
Students work with a variety of 25 graphs and charts and learn how to interpret the information provided. The format varies from one to the other: pie, column bar, horizontal bar, line/dot, and picture (volcano) graphs and table charts. Appropriate for math, Social Studies, ELA, ESL, and Spanish culture. Can be used in Gr. 6-12, adult education, college, and home school. All answer keys provided.
Grades:
6th - 11th, Higher Education, Adult Education
Types:
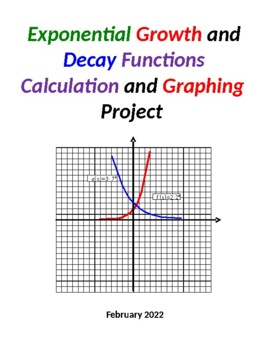
Exponential Growth & Decay Functions Calculation & Graphing Project
PLEASE NOTE: THE PREVIEW VERSION OF THIS PRODUCT IS THE ACTUAL "STUDENT VERSION" AND DOES NOT INCLUDE ANY OF THE ANSWERS TO THE PROBLEMS. THE "PRODUCT VERSION" INCLUDES DETAILED ANSWERS TO ALL OF THE PROBLEMS FOR THE PROJECT.This activity involves the calculation, graphing and coloring of exponential growth and decay functions. I have my Algebra 1/Math 1/Math 2 students complete this project toward the end of the unit on exponential functions.A total of five (5) exponential growth functions a
Subjects:
Grades:
8th - 10th
CCSS:
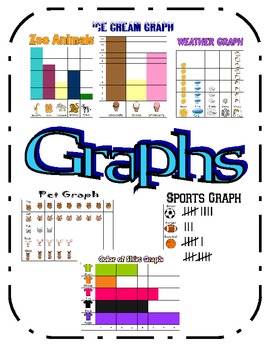
Graphs (Picture, Bar and Tally Marks)
These picture, bar and tally mark graphs can be used in a variety of ways. They can be used to display in a calendar area where you can review daily graphing questions during your calendar time. The students can use the graphs to learn how to write a question about a graph. Worksheets could be created to go with each graph. These graphs could be used in several different grade levels. For example, these graphs relate to the first grade math common core standard 1.MD.4 (Organize, represent,
Subjects:
Grades:
1st - 3rd
Types:
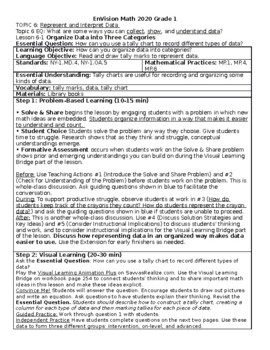
Grade 1 enVision Math 2020 Topic 6 Lesson Plans EDITABLE
Detailed and fully editable lesson plans for the newest enVision Mathematics edition 2020, Grade 1, Topic 6 Represent and Interpret DataLessons included:Lesson 6-1 - Organize Data in Three CategoriesLesson 6-2 - Collect and Represent DataLesson 6-3 - Interpret DataLesson 6-4 - Continue to Interpret DataLesson 6-5 - Problem Solving: Make Sense and PersevereCorrelated to New York State Next Generation Mathematics Learning Standards.All Topics are now available as a bundle!
Grades:
1st
Types:
CCSS:
Also included in: Grade 1 enVision Math 2020 Lesson Plans Bundle EDITABLE
Rational Functions Calculation and Graphing Project
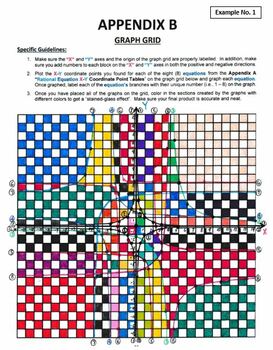
PLEASE NOTE: THE PREVIEW VERSION OF THIS PRODUCT IS THE ACTUAL "STUDENT VERSION" AND DOES NOT INCLUDE ANY OF THE ANSWERS TO THE PROBLEMS. THE PRODUCT VERSION INCLUDES DETAILED ANSWERS TO ALL OF THE PROBLEMS FOR THE PROJECT.This project activity involves the calculation, graphing and coloring of basic rational functions/equations. I have my Algebra 2, Math 3 and Precalculus students complete this project toward the end of the unit on rational functions. As noted in the TpT "Preview" section o
Subjects:
Grades:
10th - 12th
Types:
CCSS:
205 Algebra 1 Bell Work Activities for the Whole Year
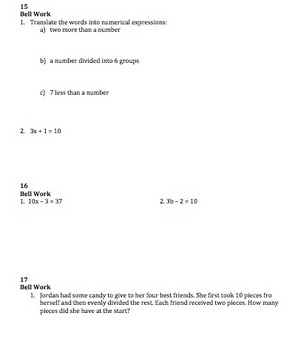
Whether you call it Bell Work, Bell Ringer, Do Now, or Jumpstart, start class strong with one of these 205 3-4 minute assignment that will reinforce Pre-Algebra and Algebra understandings. Teach Like a Champion" lists bell work (called "Do Now") as one of the successful strategies to send students on the path to college. These are the Do Nows that I use throughout the year for my Algebra 1 students but they could apply to a second semester Pre-Algebra Course as well as an Algebra 2 course.
205
Subjects:
Grades:
7th - 10th
Types:
Sped EdTpa Task 1 part E Planning Commentary score of 54
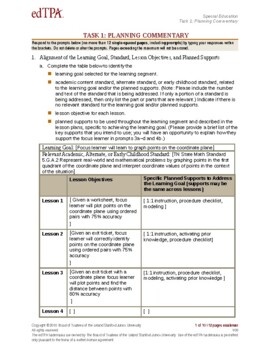
Task 1 Part E of SPED edTpa which passed with a 54 in April 2021.This is for use as a study resource or model for edTpa completion. Copying any portion of this is against edTpa rules.
Grades:
5th - 7th
Types:
CCSS:
Algebra 1 Final Exam Study Guide and 89 Practice Problems
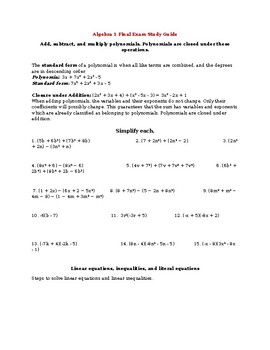
This Algebra 1 Final Exam study guide has notes, definitions, and 89 practice problems. The 89 practice problems cover the concepts from Algebra 1. The problems include graphs, word problems, equations, and expressions. The answer key for the 89 problems is also provided. The document is in word format so it can be easily adjusted or copied.
Grades:
8th - 9th
Types:
CCSS:
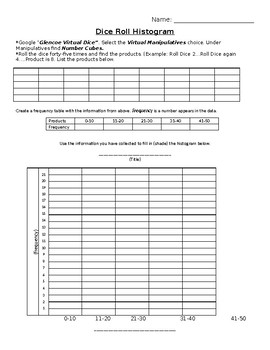
Dice Roll Histogram - Online Interactive Activity Frequency Table & Historgram
Students will complete a frequency table and histogram that corresponds to data collected through the use of rolling two dice (Statistics Lesson). To get the data for this frequency table, students will roll two dice and multiple the numbers rolled together. The product of these two rolls will be the data point. Students will write down each product, rolling their dice a total of 45 times. Students will then fill in the frequency table and graph on a histogram. We used an online dice. This helps
Subjects:
Grades:
5th - 8th
Types:
First Grade- Go Math!- Chapter 10- Lesson Plans
UPDATED to the 2015 version of Go Math!
As a Common Core Fellow for the NYCDOE, and as a facilitator for a Go Math! Implementation course for lead teachers, I have a thorough understanding of the Common Core State Standards, Standards for Mathematical Practice, and the key shifts. My lesson plans are intricately planned with all of these essential components in mind. I look at the Go Math! recommendations and make strategic adjustments to ensure that all are given appropriate weight, while also
Linear Equations Ski Resort Project w/ Timeline, Rubrics, & Peer Evaluation
Get ready to see students amaze you with their high-quality work as they demonstrate their learning of linear equations and functions. Students will design and create a model of a ski resort, using y = mx + b to construct 2-D and 3-D ski slopes! This project is great for general education classrooms, differentiated groupings, gifted learners, expeditionary learning, cumulative and summative assessments, genius hour, 80/20, passion projects, and so much more! What's best is it reaches all learnin
Grades:
7th - 10th
Types:
CCSS:
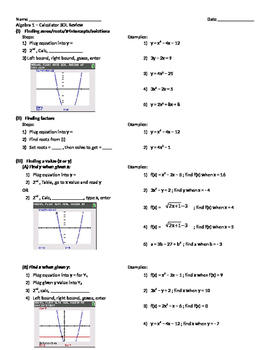
Algebra 1 Calculator Review (TI-84)
Comprehensive review of all graphing calculator concepts taught through the Algebra 1 course. Review concepts include finding roots, factors, values (x or y), y-intercept, mean, standard deviation, line/curve of best fit, and finding solutions to systems of equations. The review include steps and screenshots of the calculator.
Subjects:
Grades:
7th - 12th, Higher Education, Adult Education
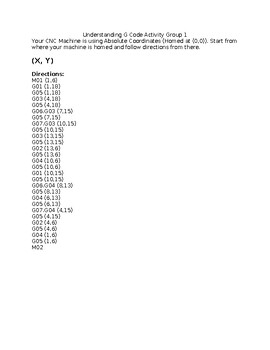
Understanding G Code Activity
Understanding G Code Activity correlates with the CNC Plasma Lesson Slides. Editable word document. Set up for 3 groups. As is, it Spells out MSU. The activity needs a gridded poster board for each group that has a defined x & y axis and a home coordinate (0,0) as well as a sharpie/ruler to draw the lines described by the G Code instructions. The activities list the graph coordinates alongside the G Codes to help with finding the correct coordinates on the poster board. It is important to me
Subjects:
Grades:
9th - 12th
Types:
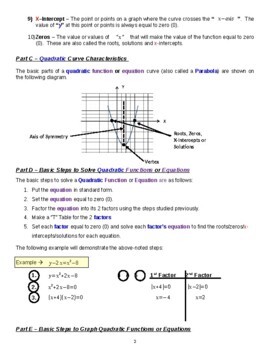
Math 1/Math 2/ Algebra 1 Quadratic Functions Calculation and Graphing Project
This activity involves the calculation, graphing and coloring of quadratic functions that have a leading coefficient = 1 only. I have my Algebra 1/Math 1/Math 2 students complete this project toward the end of the unit on quadratic functions.A total of ten (10) quadratic functions require solution and graphing by the students. A series of calculation sheets are first completed by the students following by an overall quadratic equation summary table. This is followed by the completion of ten (1
Grades:
8th - 11th
Types:
CCSS:
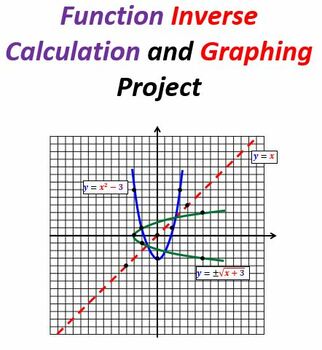
Function Inverse Calculation and Graphing Project
PLEASE NOTE: THE PREVIEW VERSION OF THIS PRODUCT IS THE ACTUAL "STUDENT VERSION" AND DOES NOT INCLUDE ANY OF THE ANSWERS TO THE PROBLEMS. THE MAIN PRODUCT VERSION INCLUDES DETAILED ANSWERS TO ALL OF THE PROBLEMS FOR THE PROJECT. This project activity involves the calculation, graphing and coloring of inverse functions including linear, quadratic, radical (square root and cube root) and cubic polynomial types. I have my Algebra 2, Math 3 and Precalculus students complete this project toward th
Subjects:
Grades:
10th - 12th
CCSS:
Graphing Polynomial Functions in Factored Form - A Discovery Exercise
Students learn math concepts best when discovering mathematical patterns on their own rather than being told by the teacher. This activity is designed for students to discover how to graph polynomials in factored form. It covers quadratic, cubic, and quartic polynomial functionsPrerequisites1. Students have learned the basics of functions2. Students have learned functional notation3. Students have been introduced to polynomial functions4. Students know how to graph a function by hand given a ta
Subjects:
Grades:
9th - 10th
Types:
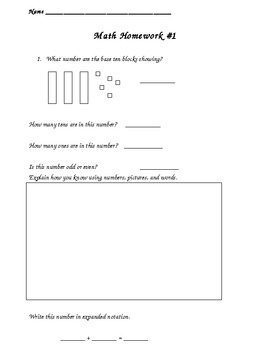
2nd Grade Math Homework
This attachment contains 30 weeks of spiraling math homework. It is based on a 2nd grade curriculum which uses problem based inquiry as its foundation. Concepts such as place value, fractions, money, time, probability,and graphing are covered. Week by week it slowly progresses to become harder and to review concepts previously learned.
Created by lcgorski
Subjects:
Grades:
2nd
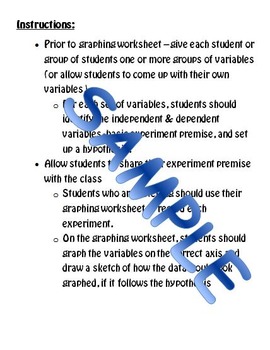
Independent Variable vs Dependent Variable Practice: Scientific Method
My high school students still struggle with keeping it straight. By now they do know the scientific method pretty well, and can set up their own experiments and analyze other experiments. But they do still confuse which variable is called Independent and which is called Dependent, and which axis they will be graphed on.I created this practice activity to use as a quick refresher to help my students practice naming variables and setting up the axis on a graph. It is simple enough that upper el
Subjects:
Grades:
9th - 12th

Graphing & Data Analysis Disney 4 Park Challenge
Students will practice graphing multiple sets of data using real time data of Disney park wait times. Student scenario: Your group is doing the 4 parks in one day challenge which means park hopping all 4 Disney Parks in one day! You will need to decide on one ride from each of the 4 parks you’d like to ride most and create a poster graphing the hourly wait times comparing the 4 rides so you can map out your day strategically. Students are also given information about the fast pass prices and wil
Subjects:
Grades:
6th - 10th
Showing 1-24 of 171 results


