29 results
2nd grade statistics worksheet microsofts
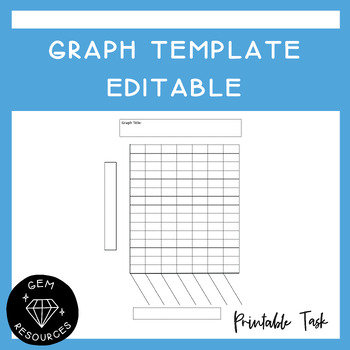
Graph Template Data and Statistics Maths Histogram Bar Column Drawing Editable
Students can use this to help them draw up a graph. It allows them to be accurate and has boxes for the titles needed for the graph.This Word document is editable.
Subjects:
Grades:
2nd - 6th
Types:
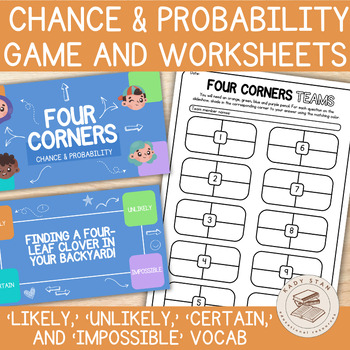
Chance and Probability Game | Slideshow Activity & Worksheets | 2nd Grade Maths
*Topic: Chance and Probability exploring the vocabulary of likely, unlikely, certain, and impossible* Our reimagined Four Corners is a dynamic classroom game where students respond to questions posed by the teacher by physically moving to one of four corners in the room, each representing a different answer option. It's a fun and interactive way to engage students whilst they learn, and you assess their understanding of the topic. THREE WAYS TO PLAY: Traditional Four CornersUtilise a digital de
Subjects:
Grades:
1st - 3rd
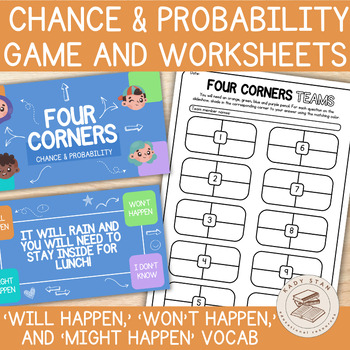
Chance and Probability Game | Slideshow Activity & Worksheets | 1st Grade Maths
*Topic: Chance and Probability exploring the vocabulary of will happen, won’t happen, and might happen* Our reimagined Four Corners is a dynamic classroom game where students respond to questions posed by the teacher by physically moving to one of four corners in the room, each representing a different answer option. It's a fun and interactive way to engage students whilst they learn, and you assess their understanding of the topic. THREE WAYS TO PLAY: Traditional Four CornersUtilise a digital
Subjects:
Grades:
1st - 3rd
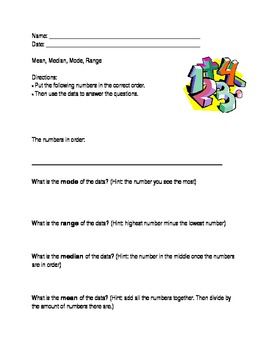
Mean, Median, Mode, Range; Modified Special Ed Math Template; Statistics
This is a modified worksheet from the middle school statistics curriculum. It is excellent for special education students who require an alternate or modified curriculum.
This worksheet allows teachers to input numbers in the blank space. This way teachers can use the template over and over with different numbers. Students are then to write the numbers in the correct order. Then, they have to find the mean, median, range, and mode. There are "hints" (formulas) that help the students differentia
Grades:
PreK - 12th
Types:
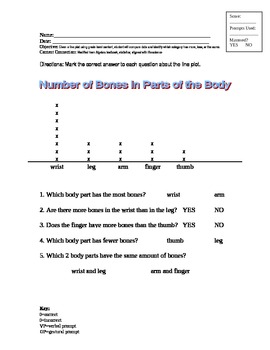
Reading a Line Plot; Modified Curriculum for Special Ed, Statistics
This line plot is modified from the middle school statistics curriculum. It is excellent for special education students who require an alternate or modified curriculum. The line plot is related to life science, and shows how many bones are in five different parts of the body. The questions on the worksheet ask questions about more and less. The answers are offered in a field of two.
This worksheet aligns with Maryland content standard:
Given a line plot using grade level content, student will c
Subjects:
Grades:
PreK - 5th
Types:
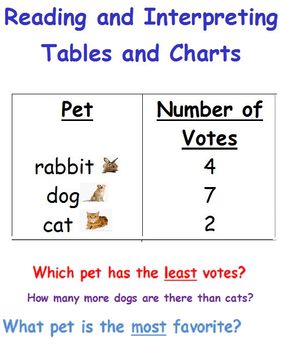
Reading a Table-Data and Statistics-First Grade
There are 4 different worksheets in which students can interpret the data of various tables. I hope they are of help to you! :)
Subjects:
Grades:
K - 3rd
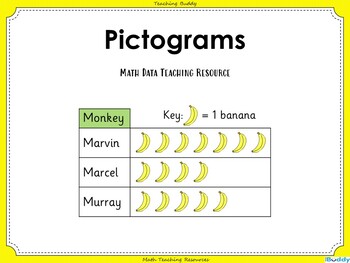
Pictograms
PictogramsIn this math teaching resource, students practice drawing and interpreting pictograms where the picture represents 1, 2, 5 or 10. Content includes:PowerPoint presentationActivities to support the teaching of this objective with six accompanying worksheetsThree further differentiated worksheets with answers'Pictograms' can be edited so you are able to adapt the resource for each class you teach.Click on the preview to see some example slides from 'Pictograms'.
Subjects:
Grades:
K - 2nd
CCSS:
Also included in: Introduction to Statistics Bundle
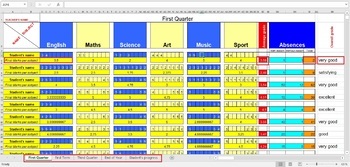
Calculate Student's Final Marks ( Grades ) in excel
If you want to easily calculate student's marks this excel document is great solution. I added all excel's necesarily formulas to make this important task so easier.When you add the marks for every subject, it's final mark will be automatically calculated. At the same time average grade will also be calculated and updated.There is also section for absences (excused and unexcused) which will also be calculated.At the end, if student's Overall grade is equal or above 4.5, it will be automaticaly w
Subjects:
Grades:
PreK - 12th, Higher Education, Adult Education, Staff
Types:
Tally charts lesson plans, worksheets and more
This is a zipped folder containing a PDF version and an editable version of the following items:
- blank tally charts
- a more detailed 2-page lesson plan (suitable for trainees)
- a less detailed one page lesson plan
Subjects:
Grades:
K - 2nd
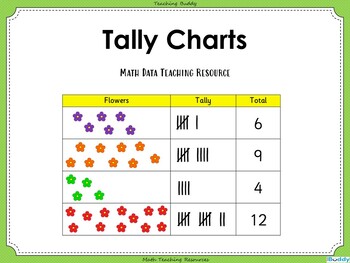
Tally Charts
Tally ChartsIn this math teaching resource, students will learn how to interpret and construct simple tally charts. Content includes:PowerPoint presentationActivities to support the teaching of this objective with two accompanying worksheetsThree further differentiated worksheets with answers'Tally Charts' can be edited so you are able to adapt the resource for each class you teach.Click on the preview to see some example slides from 'Tally Charts'.
Subjects:
Grades:
K - 2nd
CCSS:
Also included in: Introduction to Statistics Bundle
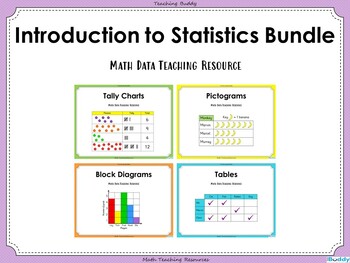
Introduction to Statistics Bundle
Introduction to Statistics BundleThis math teaching resource bundle contains 4 of our individual teaching resources:Tally ChartsPictogramsBlock DiagramsTables For a full description and preview of each resource please click on the images above.This bundle gives you a saving of 33% when compared to buying each resource individually.
Subjects:
Grades:
K - 2nd
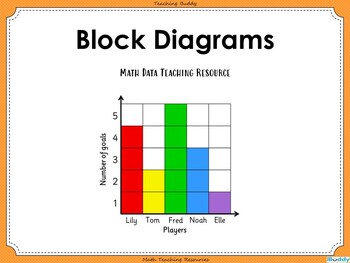
Block Diagrams
Block DiagramsIn this math teaching resource, students practice drawing, reading and using block diagrams to record information. Content includes:PowerPoint presentationActivities to support the teaching of this objective with two accompanying worksheetsThree differentiated worksheets with answers'Block Diagrams' can be edited so you are able to adapt the resource for each class you teach.Click on the preview to see some example slides from 'Block Diagrams'.
Subjects:
Grades:
K - 2nd
Also included in: Introduction to Statistics Bundle
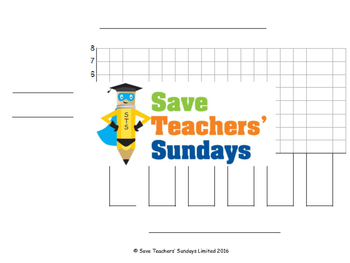
Drawing bar graphs lesson plans, worksheets and more
This is a zipped folder containing a PDF version and an editable version of the following items:
- blank bar graphs
- a more detailed 2-page lesson plan (suitable for trainees)
- a less detailed one page lesson plan
- a bar graph plenary
- drawing bar graphs success criteria
Subjects:
Grades:
K - 2nd
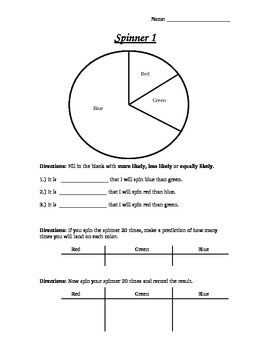
Probability Spinner Worksheets
Students color their own spinners and test out theories and predictions. There are three different activities in the pack. The lines and spinners do not line up correctly on preview but do on the document.
Subjects:
Grades:
2nd - 3rd
Types:
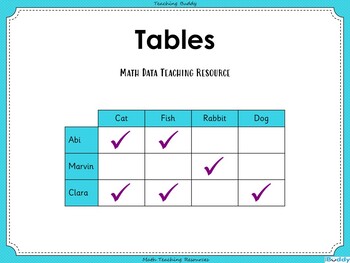
Tables
TablesIn this math teaching resource, students practice drawing and interpreting simple tables. Content includes:PowerPoint presentationActivities to support the teaching of this objective with one accompanying worksheetThree further differentiated worksheets with answers'Tables' can be edited so you are able to adapt the resource for each class you teach.Click on the preview to see some example slides from 'Tables'.
Subjects:
Grades:
K - 2nd
CCSS:
Also included in: Introduction to Statistics Bundle
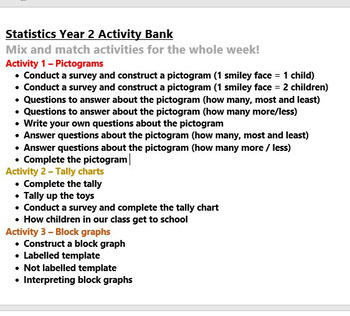
Statistics Pictograms Charts Graphs Year 2 Activity Bank (Differentiated)
19 statistics activities all in one place, mix and match them to teach the combination of skills suited for each of the ability groups in your class.
More than a week’s worth of Maths lessons without any hassle.
You can download Addition Year 2 Activity Bank for free to check the quality of my material.
Subjects:
Grades:
2nd
Types:
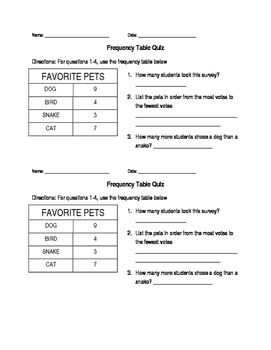
Math Frequency Table Quiz grades 1-3
This quiz is for students in grade 1, grade 2 and grade 3. The quiz has a frequency table on it and then it asks the students questions about the frequency table.
Subjects:
Grades:
1st - 3rd
Types:
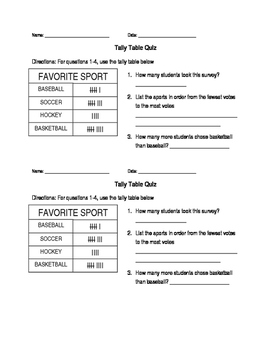
Math tally table quiz
This math tally table quiz can be used for 1st, 2nd or 3rd grade students. The quiz shows students a tally table and then asks them questions about the tally table.
Subjects:
Grades:
1st - 3rd
Types:
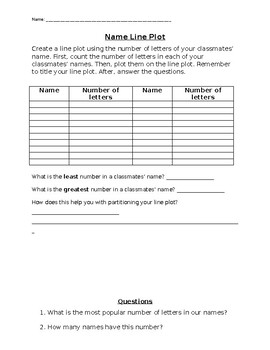
Line Plots with classmates' names
Have your students create a line plot with their classmates' names. Just type (or write) in your class list and copy!
Subjects:
Grades:
2nd - 5th
Types:
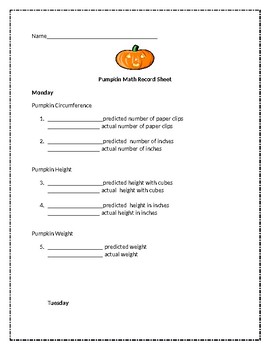
Pumpkin Math (Week Long Activities)
Throughout this fun filled week, children will explore:
-Circumference
-Weight
-Volume
- Distance
These are different hands on activities for each day of the week (Mon-Thurs)
Subjects:
Grades:
1st - 4th

Probability Graphing
Students color a spinner according to the directions, then use a paperclip to spin 10 times and graph their results. Students then use their data to answer questions about the probability of spinning each color.
Subjects:
Grades:
2nd
Types:
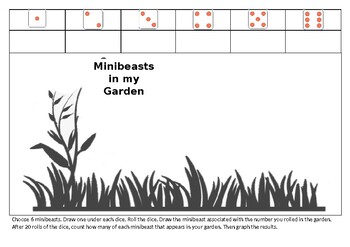
Minibeast Chance and data actitivity
Using the attached template, students work independently to collect and record data. This activity is suitable for Reception to Year 2. Choose 6 minibeasts. Draw one under each dice. Roll the dice. Draw the minibeast associated with the number you rolled in the garden. After 20 rolls of the dice, count how many of each minibeast that appears in your garden. Then graph the results.
Subjects:
Grades:
1st - 3rd
Types:
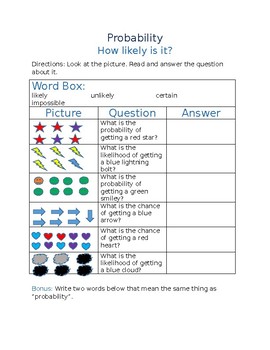
Probability Practice
This worksheet is designed to be accessible to low-fluency ELLs and other struggling readers. It focuses specifically on the vocabulary likely, unlikely, certain, and impossible. For stronger students, there is a bonus option for identifying the synonyms for “probable” found in the questions in this worksheet.
Subjects:
Grades:
2nd
Types:
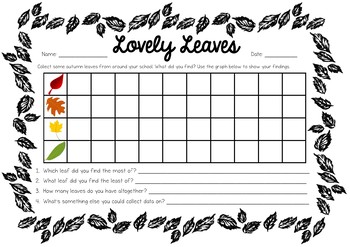
Statistics and Probability Worksheet
Make the most of the beautiful autumn leaves with you class!
Head outdoors and go for a forage for different coloured leaves. Children then sort their leaves into 4 groups (by colour red, orange, yellow and green). Students record what they found on the worksheet provided.
FULLY EDITABLE
Subjects:
Grades:
K - 3rd
Types:
Showing 1-24 of 29 results


