18 results
Kindergarten statistics worksheet microsofts
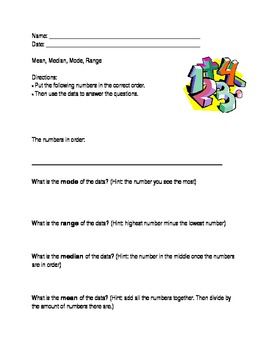
Mean, Median, Mode, Range; Modified Special Ed Math Template; Statistics
This is a modified worksheet from the middle school statistics curriculum. It is excellent for special education students who require an alternate or modified curriculum.
This worksheet allows teachers to input numbers in the blank space. This way teachers can use the template over and over with different numbers. Students are then to write the numbers in the correct order. Then, they have to find the mean, median, range, and mode. There are "hints" (formulas) that help the students differentia
Grades:
PreK - 12th
Types:
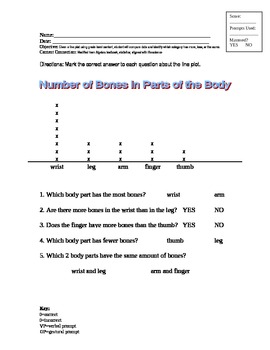
Reading a Line Plot; Modified Curriculum for Special Ed, Statistics
This line plot is modified from the middle school statistics curriculum. It is excellent for special education students who require an alternate or modified curriculum. The line plot is related to life science, and shows how many bones are in five different parts of the body. The questions on the worksheet ask questions about more and less. The answers are offered in a field of two.
This worksheet aligns with Maryland content standard:
Given a line plot using grade level content, student will c
Subjects:
Grades:
PreK - 5th
Types:
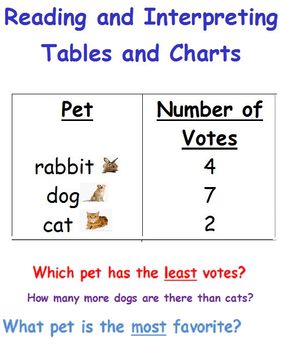
Reading a Table-Data and Statistics-First Grade
There are 4 different worksheets in which students can interpret the data of various tables. I hope they are of help to you! :)
Subjects:
Grades:
K - 3rd
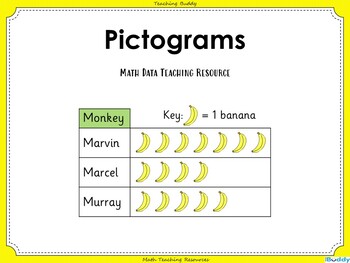
Pictograms
PictogramsIn this math teaching resource, students practice drawing and interpreting pictograms where the picture represents 1, 2, 5 or 10. Content includes:PowerPoint presentationActivities to support the teaching of this objective with six accompanying worksheetsThree further differentiated worksheets with answers'Pictograms' can be edited so you are able to adapt the resource for each class you teach.Click on the preview to see some example slides from 'Pictograms'.
Subjects:
Grades:
K - 2nd
CCSS:
Also included in: Introduction to Statistics Bundle
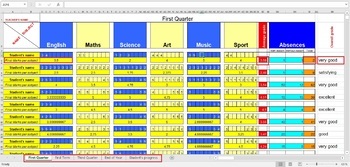
Calculate Student's Final Marks ( Grades ) in excel
If you want to easily calculate student's marks this excel document is great solution. I added all excel's necesarily formulas to make this important task so easier.When you add the marks for every subject, it's final mark will be automatically calculated. At the same time average grade will also be calculated and updated.There is also section for absences (excused and unexcused) which will also be calculated.At the end, if student's Overall grade is equal or above 4.5, it will be automaticaly w
Subjects:
Grades:
PreK - 12th, Higher Education, Adult Education, Staff
Types:
Tally charts lesson plans, worksheets and more
This is a zipped folder containing a PDF version and an editable version of the following items:
- blank tally charts
- a more detailed 2-page lesson plan (suitable for trainees)
- a less detailed one page lesson plan
Subjects:
Grades:
K - 2nd
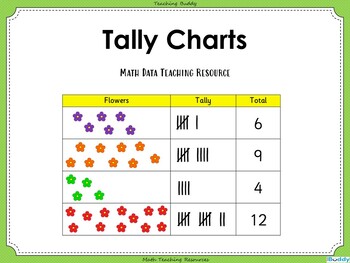
Tally Charts
Tally ChartsIn this math teaching resource, students will learn how to interpret and construct simple tally charts. Content includes:PowerPoint presentationActivities to support the teaching of this objective with two accompanying worksheetsThree further differentiated worksheets with answers'Tally Charts' can be edited so you are able to adapt the resource for each class you teach.Click on the preview to see some example slides from 'Tally Charts'.
Subjects:
Grades:
K - 2nd
CCSS:
Also included in: Introduction to Statistics Bundle
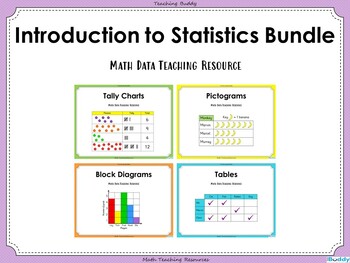
Introduction to Statistics Bundle
Introduction to Statistics BundleThis math teaching resource bundle contains 4 of our individual teaching resources:Tally ChartsPictogramsBlock DiagramsTables For a full description and preview of each resource please click on the images above.This bundle gives you a saving of 33% when compared to buying each resource individually.
Subjects:
Grades:
K - 2nd
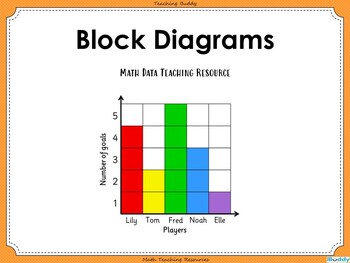
Block Diagrams
Block DiagramsIn this math teaching resource, students practice drawing, reading and using block diagrams to record information. Content includes:PowerPoint presentationActivities to support the teaching of this objective with two accompanying worksheetsThree differentiated worksheets with answers'Block Diagrams' can be edited so you are able to adapt the resource for each class you teach.Click on the preview to see some example slides from 'Block Diagrams'.
Subjects:
Grades:
K - 2nd
Also included in: Introduction to Statistics Bundle
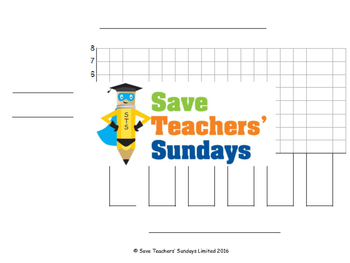
Drawing bar graphs lesson plans, worksheets and more
This is a zipped folder containing a PDF version and an editable version of the following items:
- blank bar graphs
- a more detailed 2-page lesson plan (suitable for trainees)
- a less detailed one page lesson plan
- a bar graph plenary
- drawing bar graphs success criteria
Subjects:
Grades:
K - 2nd
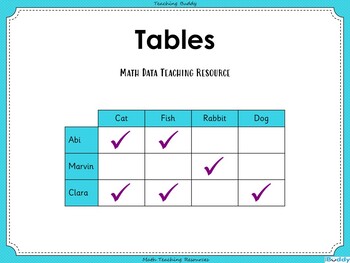
Tables
TablesIn this math teaching resource, students practice drawing and interpreting simple tables. Content includes:PowerPoint presentationActivities to support the teaching of this objective with one accompanying worksheetThree further differentiated worksheets with answers'Tables' can be edited so you are able to adapt the resource for each class you teach.Click on the preview to see some example slides from 'Tables'.
Subjects:
Grades:
K - 2nd
CCSS:
Also included in: Introduction to Statistics Bundle
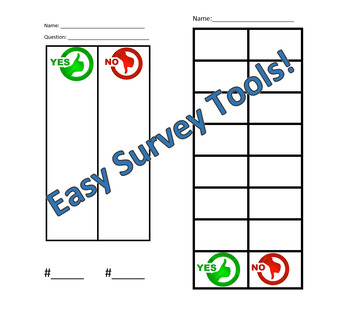
Easy Survey Tally Chart
Use this simple survey tally chart to help kids as young as 3 gather information. The chart is designed for yes or no questions.
Subjects:
Grades:
PreK - 1st
Types:
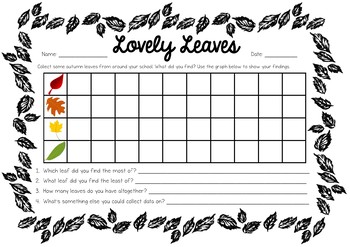
Statistics and Probability Worksheet
Make the most of the beautiful autumn leaves with you class!
Head outdoors and go for a forage for different coloured leaves. Children then sort their leaves into 4 groups (by colour red, orange, yellow and green). Students record what they found on the worksheet provided.
FULLY EDITABLE
Subjects:
Grades:
K - 3rd
Types:
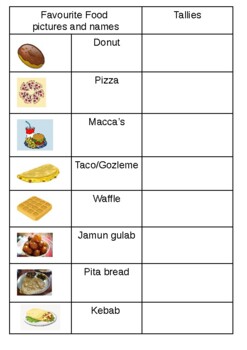
Maths - Data representation - favourite food pictograph activity cut and paste
Australian (Victorian Curriculum Year 1 and 2 levels), Maths - statistics and probability - Gathering data in a pictograph, modelling with class p.1, and task p. 2-4.Page 1 can be used as a teacher model and class data collection and pages 2-4 is the task for students that may use this for cut and paste activity to represent data using pictures for a pictograph. Foods are relatable to students of all countries.
Subjects:
Grades:
PreK - 4th
Types:
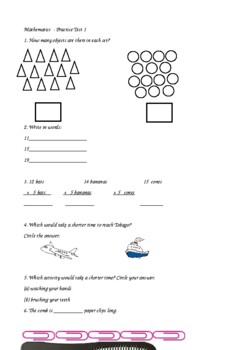
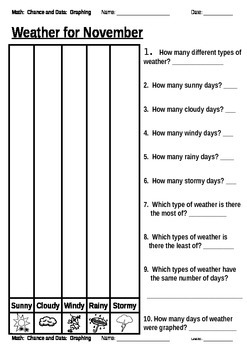
Column Graphs
A set of three column graphs for students in Grade One. The first graph is based on weather. The second is different ways we travel to school and the third graph is about different types of animals at the zoo. The last page in the document is a set of pictures for each of the graphs. Students simply cut out all the pictures, glue them into the correct columns and then answer the 10 questions that relate to the graph.
Subjects:
Grades:
K - 1st
Types:

How Does First Grade get to School Graph
Use this graph during back to school so your students can compare and contrast how they get to school through graphing. Begin as a do now with a whole class chart where they sign their name under how they get to school and continue as an independent graphing activity!
Subjects:
Grades:
K - 2nd
Types:

Sochi Olympic Medal Tally
A tally chart to keep track of Olympic achievement. Can be editted to fit classroom needs.
Subjects:
Grades:
PreK - 12th
Showing 1-18 of 18 results


