34 results
Adult education statistics worksheet microsofts
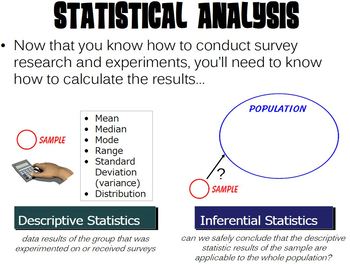
Statistical Analysis PowerPoint
Contains a PowerPoint presentation covering statistical analysis. This PP was designed to be used with a Psychology or AP Psychology course as part of a Research Methods unit, but it could also be used in a variety of math and/or statistic classes.The PowerPoint is HIGHLY animated and is designed to capture student attention. Each slide has transitions along with rich, moving media. Additionally, a guided note sheet (both an editable Microsoft Word version and a PDF version) is included in the z
Subjects:
Grades:
7th - 12th, Higher Education, Adult Education, Staff
Permutations and Factorial Notation Worksheet (17 Questions)
Permutations and Factorial Notation Worksheet17 Questions with the solutions1 page for the questions1 page for the answers* AlSO AVAILABLE FOR YOU OR A COLLEAGUE! - CLICK ANY LINK YOU WANT:Probability & OddsMean, median, mode, range, line plot, and Box and whisker WorksheetStatistical Math (GED REVIEW)The Binomial Theorem Worksheet (10Q)Theoretical Probability WorksheetProbability Word Problems (Worksheet) You may also be interested in my other top-selling products: EQUIVALENT FRACTIONS (33
Subjects:
Grades:
9th - 12th, Higher Education, Adult Education, Staff
Types:
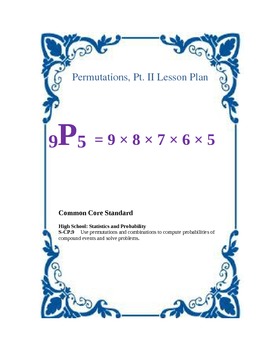
Permutations and Factorials Lesson Plans
Included on one file are two separate lesson plans. A description of each lesson follows:
Factorials & Permutations
This is a complete lesson plan that introduces factorials and "simple" permutations. Students will evaluate factorial expressions and determine the number of permutations from a number of objects.
Permutations, Pt. II
This is a complete lesson that includes more practice with permutations along with more problem solving activities.
Each lesson plan includes a warm-up activit
Subjects:
Grades:
8th - 10th, Adult Education
Types:
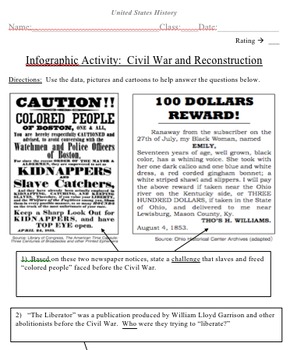
U.S. History Infographic Activity
Looking for something to help teach students how to comprehend and analyze graphs, timelines, political cartoons, posters, art and much more from U.S history? It's all here!
The content focus is on United States history and includes topics like the Civil War, Reconstruction, Women's Issues, The Roaring '20s, the Great Depression and the New Deal, the Progressive Era and the Great Society. It's all on one document, but you could easily print them off as separate, stand alone activities if yo
Subjects:
Grades:
6th - 12th, Adult Education
Types:

Mission Series #1: Averaging
Students are placed on a mission to help the teachers of Peace University average their semester grades. They are given five teacher gradebooks and asked to find the mean for each student. Guaranteed to make learning fun and engaging! Students feel a sense of adventure as they complete this simple lesson in the form of a quest. They show their understanding of this statistic concept while they fulfill their assignment. Answer Keys included.
Subjects:
Grades:
6th - 8th, Adult Education
Types:
CCSS:

Mission 2: Backwards Averaging
This packet asks students to go on a mission to help the monsters at Peace University know where best to spend their time studying for exams. Three monsters reveal the grades they have made in each of their four classes and ask the student to find out what is the minimum grade they would need to make on each subject's exam in order to get a 90% (an A) in all of their classes.As part of the instructions for the quest, a secret for solving these types of problems is revealed. As it is explained
Subjects:
Grades:
6th, Adult Education
Types:
CCSS:
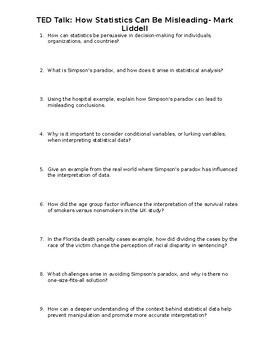
TED Talk: How Statistics Can Be Misleading- Mark Liddell
In this thought-provoking assignment, students will explore the fascinating world of statistics and the potential pitfalls of misinterpretation. Through a TED Talk titled 'How statistics can be misleading,' students will learn about Simpson's paradox, a phenomenon where aggregated data can lead to misleading conclusions when not properly analyzed.Using compelling examples such as hospital survival rates and legal sentencing disparities, students will discover how seemingly straightforward statis
Subjects:
Grades:
9th - 12th, Higher Education, Adult Education
Types:
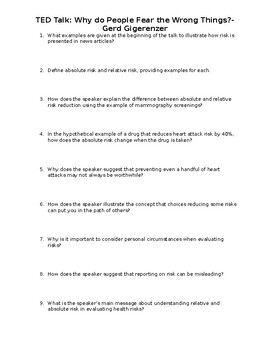
TED Talk: Why do People Fear the Wrong Things?- Gerd Gigerenzer
This assignment is based on a thought-provoking TED Talk that delves into the complexities of understanding health risks, particularly the difference between absolute and relative risk. Students will explore real-world examples, such as the impact of a new drug on heart attack risk and the increase in shark attacks, to grasp the significance of these concepts in evaluating risks.In this assignment, students will engage with the TED Talk through a set of 10 high school/college level questions tha
Subjects:
Grades:
9th - 12th, Higher Education, Adult Education
Types:
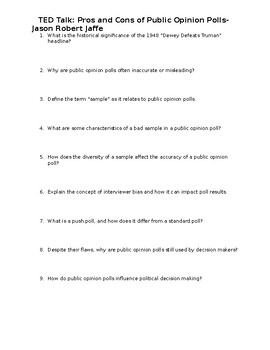
TED Talk: Pros and Cons of Public Opinion Polls- Jason Robert Jaffe
Engage your students in a thought-provoking exploration of public opinion polls with this captivating assignment based on an enlightening TED Talk. Students will delve into the complexities of polling, uncovering the reasons behind their inaccuracies and the factors that influence their results. Through a series of stimulating questions, students will examine the concept of samples, the impact of sample size and diversity, and the role of interviewer bias in shaping poll outcomes. They will also
Subjects:
Grades:
9th - 12th, Higher Education, Adult Education
Types:
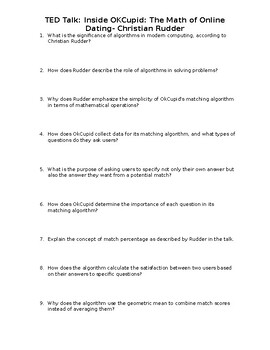
TED Talk: Inside OKCupid: The Math of Online Dating- Christian Rudder
Explore the fascinating world of algorithms with this engaging assignment based on Christian Rudder's TED Talk about OkCupid's matching algorithm. In this lesson, students will dive into the math behind OkCupid's approach to love and learn how algorithms are used to solve real-world problems.This assignment includes:A link to the TED Talk video12 high school/college-level questions to facilitate critical thinking and comprehensionAn explanation of how OkCupid's matching algorithm works, includin
Grades:
9th - 12th, Higher Education, Adult Education
Types:

Least Squares Regression Worksheet
This is a worksheet to review least squares regression. Students are provided with data of advertising expense and sales. Through a guided-question worksheet, students will create scatter-plot, find the regression line, and use the model to make estimations. They are also asked about the slope, y-intercept, linear correlation, causation, and out-of-scope situation. Teacher may also encourage discussion of business practices, such as sales and advertising. The document also contains suggested sol
Subjects:
Grades:
10th - 12th, Higher Education, Adult Education
Types:
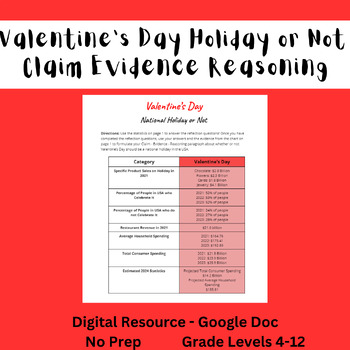
Valentines Day Digital Resource Claim Evidence Reasoning (CER) - Data and Stats
This activity is a printable, NO PREP activity to do the week of Valentine's Day! This activity outlines lots of statistics and data about Valentine's Day and asks students to objectively argue whether or not it should be a national holiday in the USA based on the statistics. There are guided reflection questions to help students with the process, before asking them to write a final decision using Claim Evidence Reasoning. This is also a great way to introduce, reinforce, or practice creative wr
Grades:
4th - 12th, Higher Education, Adult Education, Staff
Types:
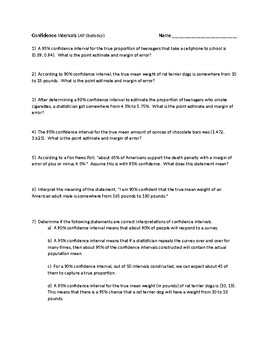
Confidence Intervals Practice Problems/Review (AP Statistics)
Confidence Interval practice problems for estimating proportions and means (z-intervals and t-intervals). Problems involve finding point estimate and margin of error when given an interval, interpreting intervals, finding needed sample size for a desired margin of error, and constructing confidence intervals. Some problems involve students needing to check conditions. A total of 22 problems (some with multiple parts). Answers included.
Subjects:
Grades:
10th - 12th, Higher Education, Adult Education
Types:

Statistical Math (GED REVIEW)
Statistical Math
Data analysis statistics and probability worksheets ,63 problems
GED Review
Fraction and Data (29 Multiple choice questions)
Statistic Problem (15 questions)
Probability Word Problems
This section contains 19 word problems about :
Simple Probability
Counting Principle
Independent Probability
Dependent Probability
Mutually Exclusive Events
Permutations
Combinations
Conditional Probability
* AlSO AVAILABLE FOR YOU OR A COLLEAGUE! - CLICK ANY LINK YOU WANT:
Geometry (GED R
Subjects:
Grades:
9th - 12th, Higher Education, Adult Education, Staff
Types:
Variety of Worksheets on Hypothesis or Significance Testing -AP Statistics, etc.
Around 10 worksheets to be used with a unit on hypothesis or significance testing. They are for AP Statistics, other typical high school level statistics courses, or introductory statistics in college.1) Introductory problems. There are two research questions that have a series of questions that introduce students to hypothesis testing (one is a test for a proportion and the other for a mean).2) Hypothesis testing vocabulary worksheet. Students will read their text to find definitions for c
Subjects:
Grades:
10th - 12th, Higher Education, Adult Education
Types:
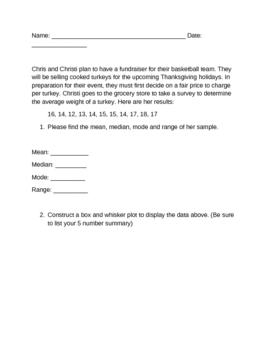
Thanksgiving Turkey Data Analysis
Answer sheets included! This activity will have students use a real life situation to analyze data and determine mean, median, mode and range. Students will also construct a box and whisker plot. An extension activity will also have them generate an equation and use the equation to solve a hypothetical question.
Subjects:
Grades:
6th - 12th, Adult Education
Types:
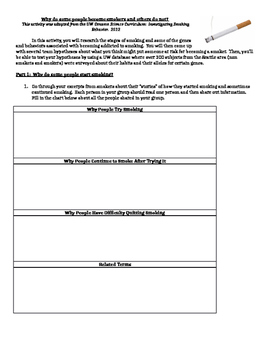
Using Big Data in Biology: Genetics, Smoking, and Statistics
This is a great multi-day lesson for higher level biology classes. The activity focuses around a large research project from the University of Washington which studied multiple factors that play into why some people start and keep smoking (addiction). It ties in genes, inheritance, then environment and statistics. Students are able to come up with their own research projects and use the online database to test their hypotheses. At the end, I have students present their results to the class a
Subjects:
Grades:
11th - 12th, Higher Education, Adult Education
Types:
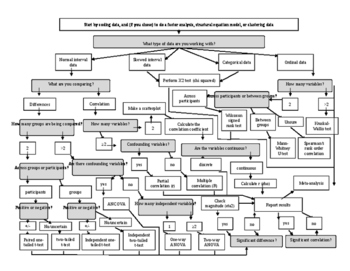
What statistic should I use? A flowchart
Provided is a flowchart to help statistics students understand what test is appropriate for what they are measuring. By responding to various dyadic questions, students can determine the test that best suits their research analytic needs.
Subjects:
Grades:
9th - 12th, Higher Education, Adult Education
Types:
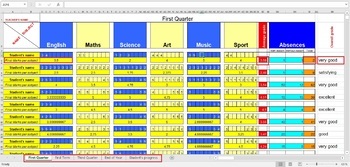
Calculate Student's Final Marks ( Grades ) in excel
If you want to easily calculate student's marks this excel document is great solution. I added all excel's necesarily formulas to make this important task so easier.When you add the marks for every subject, it's final mark will be automatically calculated. At the same time average grade will also be calculated and updated.There is also section for absences (excused and unexcused) which will also be calculated.At the end, if student's Overall grade is equal or above 4.5, it will be automaticaly w
Subjects:
Grades:
PreK - 12th, Higher Education, Adult Education, Staff
Types:
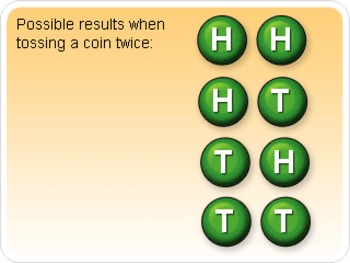
Compound Events Worksheet (10 Q)
Compound Events Worksheet
10 word problems worksheet
Subjects:
Grades:
3rd - 12th, Higher Education, Adult Education, Staff
Types:
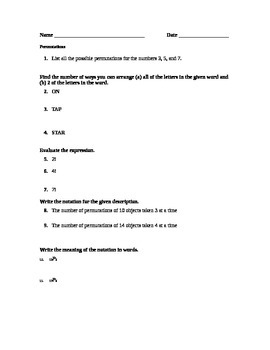
Permutations Quiz or Worksheet
This is a 20 question permutation quiz or practice worksheet. Can be used in Algebra 1, 2 or Statistics.
Subjects:
Grades:
7th - 12th, Higher Education, Adult Education, Staff
Types:
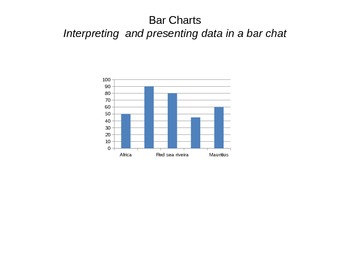
bar charts
Are you in need of proper bar charts worksheets and teaching materials? Do you want your student to be able to read, interpret and accurately present data in a bar chart? then this pack is exactly what you need. Go a head, take it with you and lets have a fantastic math lesson!!!!
Subjects:
Grades:
7th - 12th, Adult Education
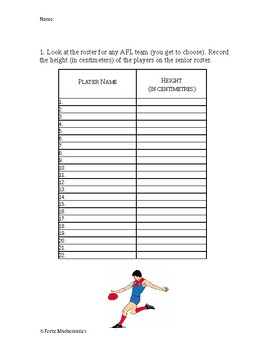
AFL Box and Whisker Plot Investigation
An engaging Mathematics investigation that can be used as a formative or summative assessment for a range of year levels. Students are assessed on their understanding of:Constructing a box and whisker plot from a set of dataRemoving the outlier (or largest number) and analysing the resulting changes to the box and whisker plotComparing a pair of box and whisker plots to analyse the similarities and differences in the dataAnalysing a set of graphs and matching data from a box and whisker plo
Subjects:
Grades:
7th - 12th, Higher Education, Adult Education, Staff
Types:
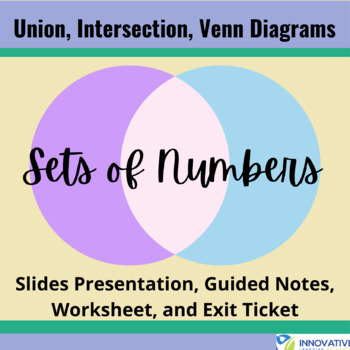
Number Sets - Slides Lesson, Guided Notes, Worksheet, Exit Ticket
This NO PREP product is perfect for teaching about sets of numbers! It include a colorful 9 slide presentation, guided notes, practice worksheet, and exit ticket. Topics includes set, element, empty set, union, intersection, and venn diagrams. Assign the worksheet as homework, classwork, or for a quiz.www.InnovativeLearning2.com#numbersets#algebra#math
Subjects:
Grades:
7th - 12th, Higher Education, Adult Education, Staff
Showing 1-24 of 34 results


