32 results
2nd grade statistics assessment microsofts
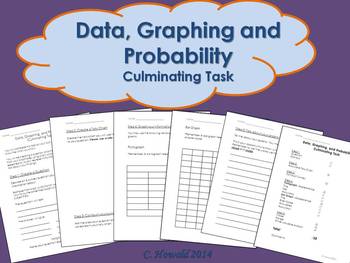
Graphing Unit Culminating Project
I used this activity as a summative assessment for my Data, Graphing and Probability Unit. This gave students the opportunity to create their own question, survey a group of students (visited another class in the school), collect, display and analyze their data.
I have left this as a .doc file so that you are able to adjust it to fit the needs of your classroom.
If you have any questions or concerns, let me know!
Thanks for downloading. Please take the time to rate this product.
If you e
Subjects:
Grades:
2nd - 4th
Types:
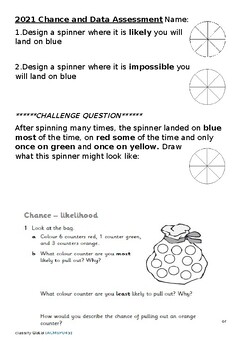
Chance and Data Test Assessment ACARA Year 2 Australia
This is a test that I use with my Year 2 Australian students to assess the ACARA outcomes for the strand Statistics and Probability, Chance and Data. It is a WORD doc, so fully editable. My tests allow for the 5 point scale, so often have harder questions or sums to allow for the higher marks. Students are told these harder questions are optional.The ACARA outcomes are: Identify practical activities and everyday events that involve chance. Describe outcomes as ‘likely’ or ‘unlikely’ and identify
Subjects:
Grades:
2nd
Types:
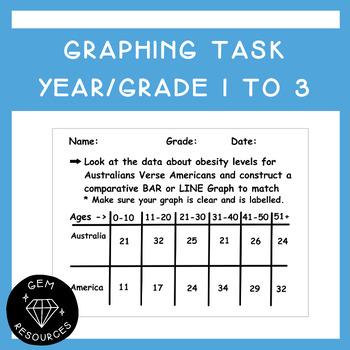
Graphing Assessment/Activity - Year/Grade 1 to 3 Data Statistics Maths
Students are required to:- create a comparative line or bar graph- show appropriate labelling to their graph- make statements about the data- make predictions based off the data- pose further questions in relation to the data for real world scenariosThis document is a PowerPoint.
Subjects:
Grades:
1st - 3rd

Probability: PowerPoint Lesson, Leveled Practice, Assessment
Teach, practice, and assess probability with this bundle!
The .zip file includes:
1- Probability Powerpoint Lesson
2- Below-Level Practice Sheet
3- On-Level/Advanced Practice Sheet
4- Assessment
Subjects:
Grades:
1st - 5th
Data and Probability SOL jeopardy game
This Jeopardy game covers SOL 3.17 and 3.18
Students can work in partners, small groups or in centers to complete this Jeopardy Game.
It can be used to review at the end of the unit OR as an SOL review
*Some questions require students to create a graph.
Subjects:
Grades:
2nd - 4th
Types:
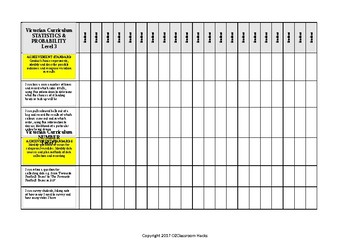
Mathematics STATISTIC PROBABILITY Checklist Level 3 Victorian Curriculum 'I Can'
Level 3 Statistics and Probability Checklist aligned with the Victorian Curriculum. Fed up with recreating new checklists - ME TOO! Hope this helps. Here is a checklist completely aligned with the Victorian Curriculum. All put simply in 'I Can' statements as YOU WOULD TEACH IT!
MAKE LIFE SIMPLE! Teaching is time consuming enough.
Subjects:
Grades:
PreK - 6th
Types:

VicVELs Child Friendly Stats and Probability Footsteps Foundation to 6
Student friendly lists of VicVELs achievement standards for Statistics and Probability for Foundation to Level 6. These achievement standards are presented in a fun way for students and translated into child friendly language. Standards have also been broken into individual statements.
Subjects:
Grades:
PreK - 6th
Types:
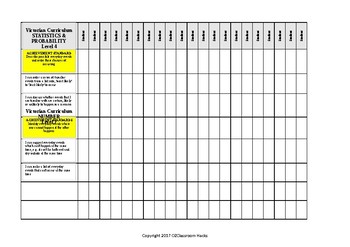
Mathematics STATISTIC PROBABILITY Checklist Level 4 Victorian Curriculum 'I Can'
Level 4 Statistics & Probability Checklist aligned with the Victorian Curriculum. Fed up with recreating new checklists - ME TOO! Here is a checklist completely aligned with the Victorian Curriculum, with 'I Can' statements breaking down each achievement standard.
These checklists can be used for assessment, reporting and for planning your curriculum so that you know you are covering everything set out in the Victorian Curriculum.
Each of these I Can statements can be used in your weekly pla
Subjects:
Grades:
2nd - 7th
Types:
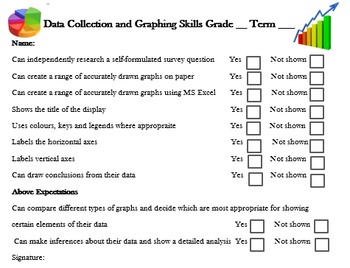
Graph and Data Assessment Checklist & Rubric
Short and quick-to-mark assessment rubric and checklist for graphing tasks suitable for students from grades 2 to 6.
You may also like:
-Comprehensive Multiplication Unit for free
- All Materials Maths units, just click on my store logo to view the full range.
Full set of Maths Assessments:
- Place Value Assessment
- Addition Assessment
- Subtraction Assessment
- Multiplication Assessment
- Division Assessment
- Fractions/Decimals Assessment
Subjects:
Grades:
2nd - 6th
Types:
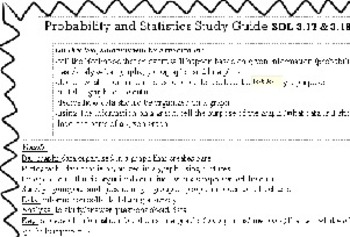
Graphing & Probability Study Guide
This is a study guide that I recently gave my students to help them study for their unit test on graphs and probability. This study guide gives the definitions of: bar graph, pictograph, line plot, survey, data, analyze, key, and probability. Then it has sample problems dealing with the 3 graphs (line plot, picto, and bar) and a few dealing with probability (certain, likely, unlikely, as likely as/equally likely, and impossible).
I have left the study guide in the publisher format in case you w
Subjects:
Grades:
1st - 5th
Types:

Tally Chart & Graph
My first graders loved doing this activity! Students get to pick their own category and choices then ask as many other students/people in the room as they can without double asking. Then they transfer their data to the the graph! This was a great, fun and engaging way to assess their learning during our data collection unit! Enjoy!
Subjects:
Grades:
1st - 2nd
Types:
CCSS:
VicVELS Statistics and Probability Achievement Standards Class Checklist
VicVELs Achievement Standards for Statistics and Probability presented in a class checklist for primary levels, foundation to level 6. Great assessment tracker tool.
Subjects:
Grades:
PreK - 6th
Types:
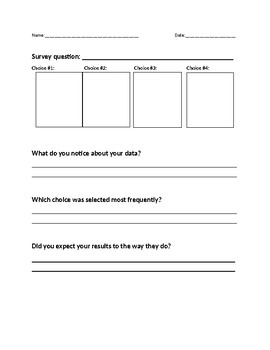
Survey Question and Graphing Project
This project is a great assessment tool to see if your student can create their own survey question, collect data, graph the data and answer questions about their result! It allows for student choice when determining the survey question and answer choices.
Subjects:
Grades:
2nd - 3rd
Types:
CCSS:
Showing Probability
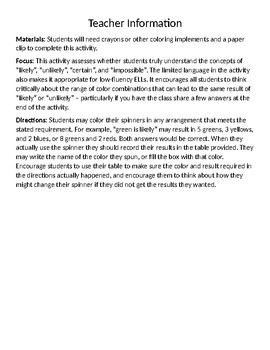
This activity assesses whether students truly understand the concepts of “likely”, “unlikely”, “certain”, and “impossible”. The limited language in the activity also makes it appropriate for low-fluency ELLs. It encourages all students to think critically about the range of color combinations that can lead to the same result of “likely” or “unlikely” – particularly if you have the class share a few answers at the end of the activity.
Subjects:
Grades:
2nd
Types:
Probability Practice
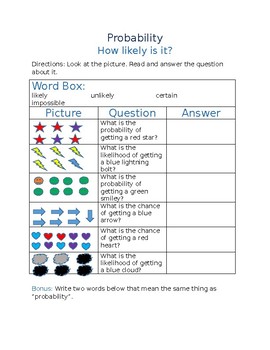
This worksheet is designed to be accessible to low-fluency ELLs and other struggling readers. It focuses specifically on the vocabulary likely, unlikely, certain, and impossible. For stronger students, there is a bonus option for identifying the synonyms for “probable” found in the questions in this worksheet.
Subjects:
Grades:
2nd
Types:
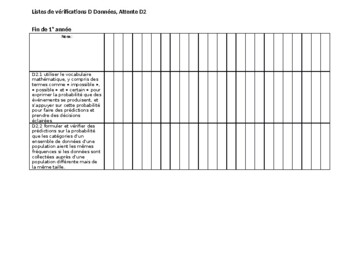
Tableau de curriculum de maths, Ontario 2020, Domaine D2
Voici le nouveau curriculum de maths, Domaine D2 (Données) sous forme de tableau Word, prêt à accepter les noms de vos élèves pour vous servir de liste de vérification ou évaluation. Vous pouvez également y mettre les mois de l'année afin de travailler votre planification à long terme! Toutes les attentes sont inclues, de la 1ère année à la 6ème, avec seulement de petits changements afin de faire rentrer toutes les attentes sur une seule page. Autres domaines disponibles!
Subjects:
Grades:
1st - 6th, Staff
Also included in: Tableaux de curriculum de maths, Ontario 2020
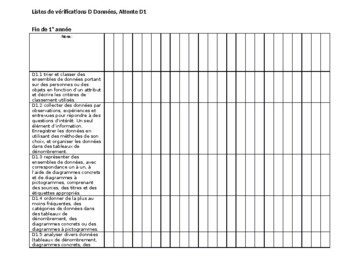
Tableau de curriculum de maths, Ontario 2020, Domaine D1
Voici le nouveau curriculum de maths, Domaine D1 (Données) sous forme de tableau Word, prêt à accepter les noms de vos élèves pour vous servir de liste de vérification ou évaluation. Vous pouvez également y mettre les mois de l'année afin de travailler votre planification à long terme! Toutes les attentes sont inclues, de la 1ère année à la 6ème, avec seulement de petits changements afin de faire rentrer toutes les attentes sur une seule page. Autres domaines disponibles!
Subjects:
Grades:
1st - 6th, Staff
Also included in: Tableaux de curriculum de maths, Ontario 2020
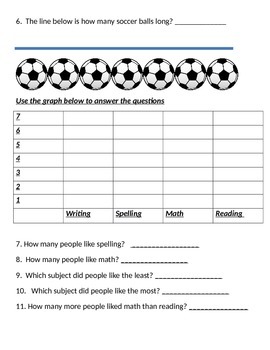
Non Standard units of measure and graphing assessment
great for homework, as well!
Subjects:
Grades:
K - 3rd
Types:
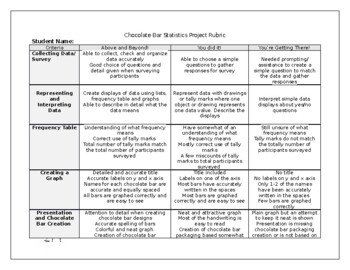
Chocolate Factory Statistics and Probability Project RUBRIC
An additional and more detailed rubric for the Chocolate Factory Statistics and Probability Project
Subjects:
Grades:
1st - 3rd
Types:
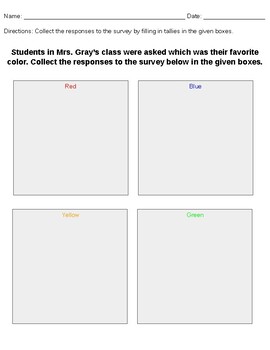
Survey Recording- Learning to tally
We used this as part of the MCAS-Alt, but can be used to teach how to record survey data. I have uploaded this as a powerpoint so that you are able to fully edit it as you need, including names. Each page has 4 categories that students can use to take survey data.
Subjects:
Grades:
PreK - 2nd
Types:
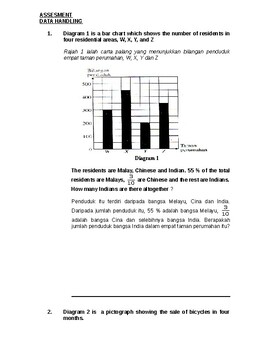
MODUL BASED ON PROBLEM SOLUTION SKILLS FOR MATH (DATA HANDLING)
This module is built on: -1. Problems identified based on the previous EXAM analysis, the failure factor of students achieving A in Mathematics EXAM is due to being unable to master the optimal level of Problem Solving skills.2. Mastery solving the entire question according to the time allocated is also a cause of the students unable to obtain excellent results in Mathematics.3. Pupils are also less exposed to the methods and techniques of problem solving quickly and accurately.
Subjects:
Grades:
2nd - 9th
Types:
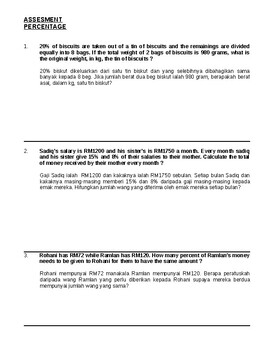
MODUL BASED ON PROBLEM SOLUTION SKILLS FOR MATH (PERCENTAGE)
This module is built on: -1. Problems identified based on the previous EXAM analysis, the failure factor of students achieving A in Mathematics EXAM is due to being unable to master the optimal level of Problem Solving skills.2. Mastery solving the entire question according to the time allocated is also a cause of the students unable to obtain excellent results in Mathematics.3. Pupils are also less exposed to the methods and techniques of problem solving quickly and accurately.
Subjects:
Grades:
2nd - 11th
Types:

~Probability line TEST grade 2/3
Students use the probability line to answer the questions.
Chance language- impossible, unlikely, even chance, likely, certain
Subjects:
Grades:
1st - 5th
Types:
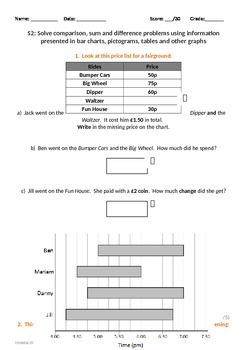
Statistics: Sum and Difference Problems
Assessment for answering and solving problems using data from charts or graphs. Free mark scheme can be downloaded for all assessments including this one.
Subjects:
Grades:
2nd - 5th
Types:
Showing 1-24 of 32 results


