33 results
Free not grade specific statistics independent works
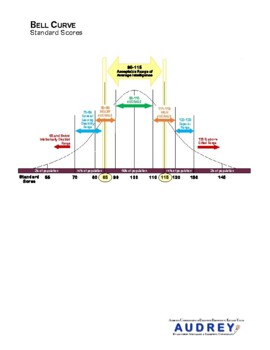
Special Education Evaluation Bell Curve SpEd Evaluation Diagnostician
Graphic to help explain standard scores to parents. See my other listings with the full version that contains information for parents.
Subjects:
Grades:
Not Grade Specific
Types:
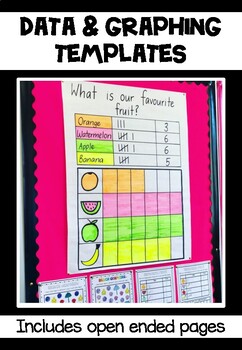
Graphing & Data Collection Templates
5 activities included: •Count/colour/graph the beach objects•Tally & graph favourite fruit• Would you rather donuts or cake? •Open ended graphing task where students can choose what to collect data about- either 'favourite ____' or 'would you rather ____ or _____'. American spelling versions are also included!
Subjects:
Grades:
Not Grade Specific
Types:
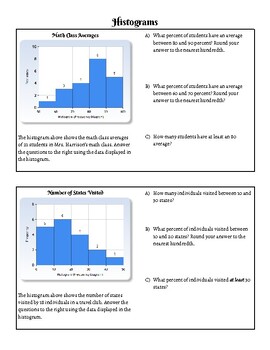
Histogram Practice Sheet
Aligned to the Algebra 1 NYS Next Gen Learning Standards- NY-6.SP4: Display quantitative data in plots on a number line, including dot plots, and histograms.This is a practice sheet to help students master histograms. Students will interpret the data from two histograms, and then construct their own histogram to represent a set of data. Designed to take about 20 minutes to complete
Subjects:
Grades:
Not Grade Specific
Types:
CCSS:
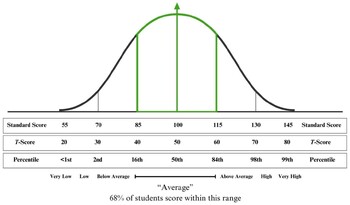
Bell Curve Diagram, Standard Scores, T-Scores, Percentiles
This bell curve diagram helps to illustrate standard scores, T-scores, percentiles, and qualitative descriptors. Print and bring to meetings to explain scores to team members, or include directly in your psychoeducational reports.
Subjects:
Grades:
Not Grade Specific
Types:
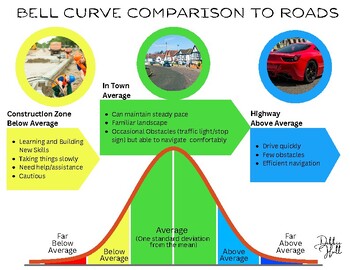
Bell Curve Comparison/Analogy to Roads
Embark on a journey of comprehension with this printable document, designed to demystify the complexities of standard curve data interpretation using a relatable road analogy. This image serves as a valuable resource for evaluation meetings, educational settings, or any scenario where understanding statistical distributions is paramount. You can use this image to explain standard scores to students, parents and staff. In the realm of driving, imagine your skill level as the journey on a road.
Grades:
Not Grade Specific
Types:
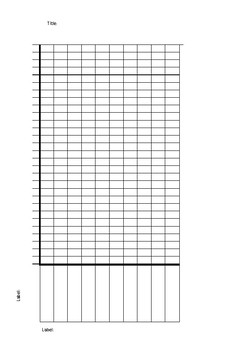
Bar Graph / Bar Chart Template
A simple template for creating bar graphs.
Includes spaces for labelling parts of the graph.
Printed to size, this will fit on one page of a standard Maths book.
Subjects:
Grades:
Not Grade Specific
Types:
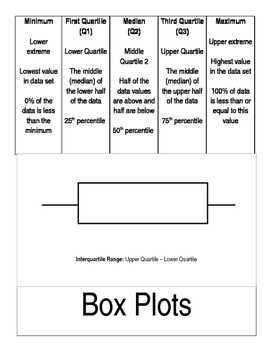
Box Plot Foldable
Foldable to teach the basics of a Box and Whisker Plot
Subjects:
Grades:
Not Grade Specific
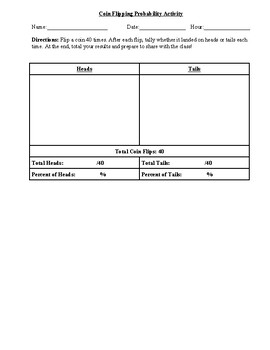
Coin Flipping Probability (Activity)
This activity allows students to do something kinesthetically in coin flipping while also practicing basic probability and statistics. This was originally designed to coincide with Mendelian genetics, but could easily be utilized elsewhere.
Subjects:
Grades:
Not Grade Specific
Types:
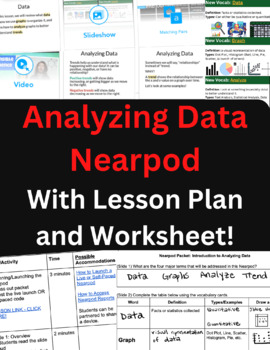
Analyzing Data Nearpod (Lesson Plan Included)
This Nearpod* activity is an introduction to analyzing data that works to either introduce the topic or review the key points. It starts by reviewing the two kinds of data (qualitative and quantitative) and common graphs (Line, Bar/Histogram, Dot Plots). Then it explores how to read a graph to see trends (positive/negative/no relationship) and gives students opportunities to practice reading graphs to identify whether there is a trend.What's Included:In addition to the Nearpod (9 slides), this d
Subjects:
Grades:
Not Grade Specific
Types:
NGSS:
MS-ETS1-3

The Lion President- A Story about Percents/Percentages
I discovered recently that students of all ages respond very well to classic children's books with pictures. I decided to make my own to introduce our math percents unit with a practical example. Sure enough, my students loved it! I simply projected this and in my classroom and read through, which took about 10 minutes. Anyway, I thought I would share. All art was made with an AI generator.Please let me know if you enjoy!
Subjects:
Grades:
Not Grade Specific
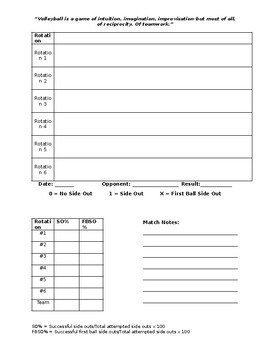
Volleyball Side Out Tracking Stat Sheet
Track your Side Out Percentage and First Ball Side Out Percentage with this detailed yet easy to use template. Includes rotation by rotation and whole team analysis.
Subjects:
Grades:
Not Grade Specific
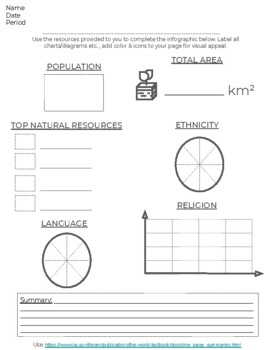
Country Infographic Worksheet
Print & Create a simple and informative infographic, with a summary for a country of your choosing based on the latest information found at the CIAworldfactbook one-page summary page, Junior Scholastic Almanac, or other sources. Great for introducing a new area of study. The second page of the PDF includes a dotted frame to assist your learners in cutting out to place in their interactive notebook!- Pro Tip: Use these sheets for comparing two countries or time periods in the same area to sh
Grades:
Not Grade Specific
CCSS:
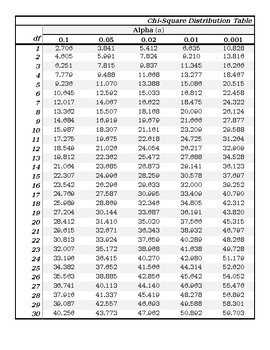
Chi-Square Distribution Table for Easy Student Use
Tired of trying to make the Chi-Square Tables you find online actually readable? Look no further! What makes this Chi-Square Table better?It only includes the five more commonly used Alphas, creating less confusion for students.The numbers, rows, and columns are clearly defined and easy to read.The document can be copied, pasted, and resized to include in your exams, homework, or notes. You can edit and change the table to fit your needs!Tables should be a tool that makes our lives and our stude
Subjects:
Grades:
Not Grade Specific
Types:
CCSS:
NGSS:
HS-LS3-3
, HS-LS4-3

TED Talk Handout - 100 Solutions to Reverse Global Warming
Handout to go with TED Talk - 100 Solutions to Reverse Global Warming by Chad Frischmann.I used it in my Statistics classroom as an introduction to a unit on climate change, but it would be great for an environmental studies class or ecology class as well.
Subjects:
Grades:
Not Grade Specific
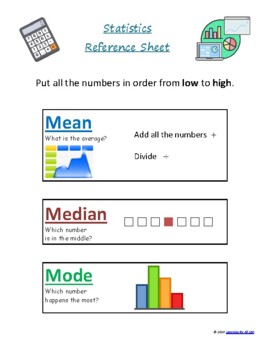
Statistics Reference Sheet
This is a simple visual reference sheet to help students calculate:MeanMedianModeRangeThe terms "Minimum" and "Maximum" are also defined.
Subjects:
Grades:
Not Grade Specific
Types:
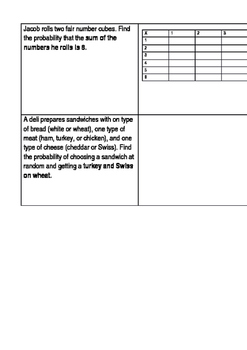
Theoretical Probability of Compound Events
Foldable that breaks down the 3 ways to do Compound Probability of Theoretical Events: Table, Tree, and List
Subjects:
Grades:
Not Grade Specific
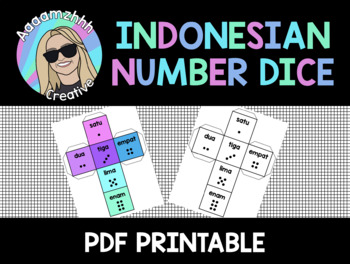
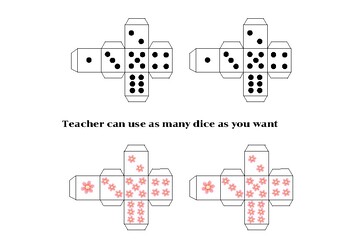
Indonesian Number Paper Dice Printable
Paper dice printable. Provided in colour and blackline.Use with any board game that requires a 6 sided dice to utilise Indonesian language in more facets of your game.Colours and font match the number posters also available in my store for teachers who like matching resources.
Subjects:
Grades:
Not Grade Specific
Types:

Measures of Centre & Spread
This activity allows students to explore the process of collecting data, analysing data and displaying data in graphs.
Students must collect data from their peers for 3 questions plus a questions of their own. They then must calculate the measures of centre for their data collected. Finally, they must graph their data for each question using a column graph, bar graph, dot plot and stem-and-leaf plot.
*You could include finding range to cover measure of spread in the activity.
Subjects:
Grades:
Not Grade Specific
Types:
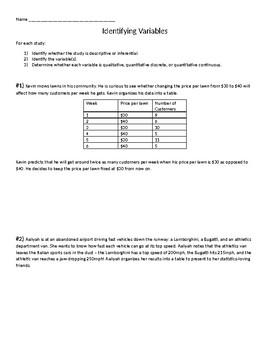
Statistics: Identifying & Analyzing Variables
Students explore a collection of statistical studies with the purpose of identify and analyze the variables within.Students are asked to:1) Identify whether the study is descriptive or inferential.2) Identify variables in the study.3) Determine whether each variable is qualitative, quantitative discrete, or quantitative continuous.
Subjects:
Grades:
Not Grade Specific
Types:
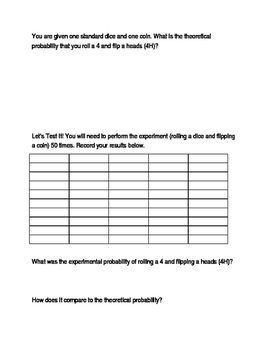
Comparing Theoretical and Experimental Probability
This activity involves finding the experimental and theoretical probability of a compound event (rolling a dice and flipping a coin).
Subjects:
Grades:
Not Grade Specific
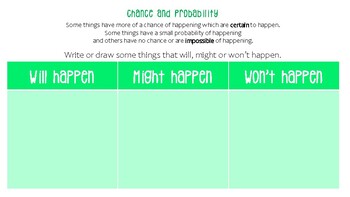
Chance and Probability
Chance and ProbabilityHave children write or draw some things that will, might or won't happen based on their chance of occurrence.This can be copied in black and white for children to draw and stick into books or slipped into a reusable A4 sleeve and used with whiteboard markers as a small group or whole class.
Subjects:
Grades:
Not Grade Specific
Types:
The brain-shaped mind: what the brain can tell us about the mind pdf
In the same way atomic structures explain the physical properties of an object, neuroscientists are now learning about the human mind by examining how the neurons in the brain are connected to one another and their surrounding environments. Will brain scientists ever be capable of reading minds? Why are certain things harder to remember than others? The Brain-Shaped Mind addresses these and other questions to provide a clear account of how the structure of the brain influences the workings of th
Subjects:
Grades:
Not Grade Specific
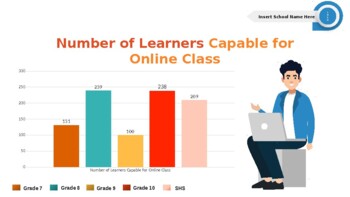
Animated School Report/Infographics for Staff and Teachers
This product is composed of different animated graphs/charts needed for school reports and statistics such as:Number of enrolleesNumber of DropoutsAssesment ResultsCapability of learning onlineNumber of transfereeAnd many more. All of them are editable for your own data.This is perfect for school heads/teachers/principals/staff.
Grades:
Not Grade Specific
Showing 1-24 of 33 results


