371 results
Free 6th grade statistics independent works
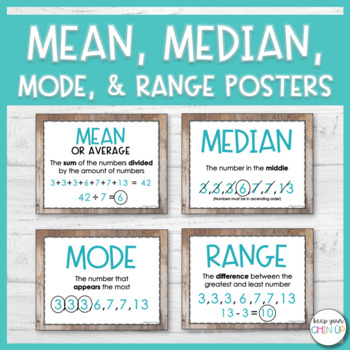
Mean, Median, Mode, and Range Posters
Looking for a visual to help your students with determining the mean, median, mode, and range of a data set? These simple posters are designed to help your students remember key words and formulas for each of the terms.
WHAT'S INCLUDED?
► 2 Options for printing (color or black & white)
► Posters for the terms: mean, median, mode, range, and data set
► Vocabulary worksheet
► Practice worksheet
Subjects:
Grades:
4th - 6th
Types:
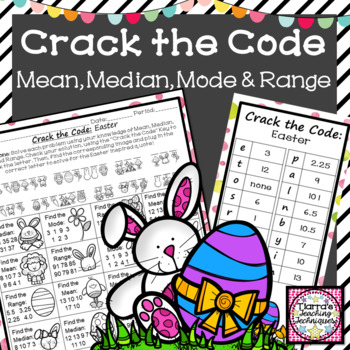
Crack the Code Mean Median Mode and Range Activity
This Easter FREEBIE is the perfect activity to supplement your lesson on Mean, Median, Mode and Range! This Measure of Central Tendency activity includes 16 Problems with an additional Challenge Question for your fast finishers. Students will solve each problem then use the "Crack the Code" Key to match an image with a letter in order to solve for an Easter inspired quote. Use as a whole group activity, small group even centers! Great component to academic practice (homework) and checking for
Subjects:
Grades:
5th - 6th
Types:
CCSS:
Also included in: Holiday Math Worksheets Crack the Code Growing Bundle
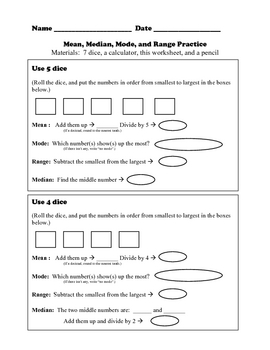
Mean, Median, Mode, and Range - Dice Practice Activity
This is a quick activity that I came up with for my seventh grade special needs students. It involves the students rolling different combinations of dice and finding the mean, median, mode and range for what they rolled. It is a very guided activity and provides prompts throughout. I did one example problem on the board, and all of my students were able to progress through the activity independently. If used with a larger group, a teacher would probably want to pair up the students so that t
Subjects:
Grades:
5th - 8th
Types:
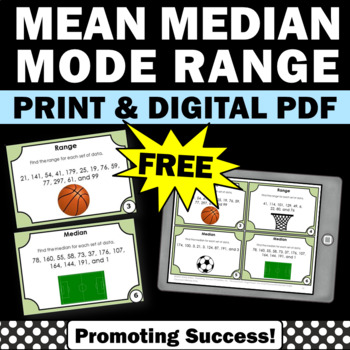
FREE Statistics and Probability Mean Median Mode Range Task Cards 5th 6th Grade
DIGITAL PDF AND PRINTABLES: You will download six free mean, median, mode and range task cards for your 5th or 6th grade students to practice finding the mean, median, mode and range. You may use the printable task cards in math centers or stations for fun review games and activities, such as a scavenger hunt or SCOOT. They also work well for transition activities, as exit tickets and for morning work, quick formative assessments. Game ideas, a student response form and answer key are included.✔
Subjects:
Grades:
5th - 6th
Types:
CCSS:
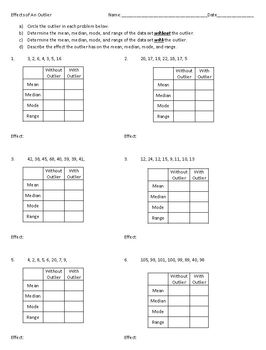
Effects of an Outlier on Mean, Median, Mode, and Range
This worksheet helps reinforce the effect of an outlier on the mean, median, mode, and range of a data set. Six data sets are provided. Students must calculate the mean, median, mode, and range of each data set with the outlier included, then with the outlier excluded. They must then determine what effect the outlier has on these statistics when included in the data set. A complete answer key is also provided.
Subjects:
Grades:
6th - 9th
Types:
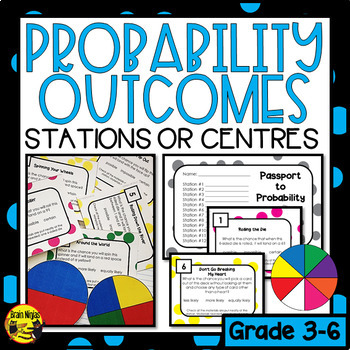
Describing Probability Outcomes Task Cards
Your students can explore probability by moving through twelve stations that each pose a question which can be answered with more likely, less likely, equally likely, possible, impossible or certain. This easy to use product includes:instructions to set up the stations (or use the activities as task cards).templates to make spinners (both in colour and ink-saving options).student recording pages.task cards for twelve stations (with materials listed on each card).answer key.One questions reads: W
Subjects:
Grades:
3rd - 6th
Types:
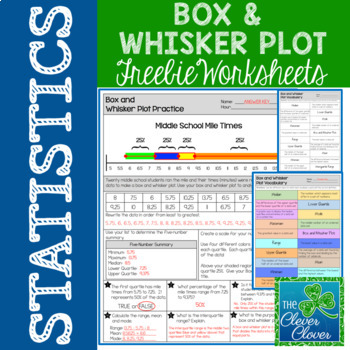
Box and Whisker Plot - FREEBIE
This resource can be used for practice with creating and interpreting box and whisker plots. Students will use twenty mile times in order to calculate the five number summary. Space is provided for students to list the numbers in order from least to greatest. Students are directed to shade and label each quartile of the box and whisker plot. After the plot has been drawn, students can answer six questions pertaining to the data.
Practice with vocabulary is also important. Students can use
Subjects:
Grades:
6th - 9th, Adult Education
Types:
Also included in: Statistics Bundle - Guided Notes, Worksheets & Scavenger Hunts!
FREE Water Bottle Flip Line Plot Activity
Have your student flip water bottles and see how many times they successfully flip it! Record data and create a line plot!
Check out my other line plot activity here!
Fidget Spinner Line Plot
Subjects:
Grades:
3rd - 8th
Types:
Also included in: Probability Activity BUNDLE
FREE Activity!! Histograms - 6th Grade Math - Statistics
This resource is a 3-page student handout on interpreting and describing information found in histograms.
The answer key is shown in the thumbnails above.
This activity is one of the activities in a 6th grade resource on statistics and probability. See this bundle by clicking below.
Common Core Math 6th Grade - Statistics and Probability - CCSS 6.SP
Enjoy using the FREE activity!!
Additional 6th grade resources are listed below.
Math Board Games Bundle - 6th Grade - (6.RP) (6.NS) (6.EE) (6
Subjects:
Grades:
6th
Types:
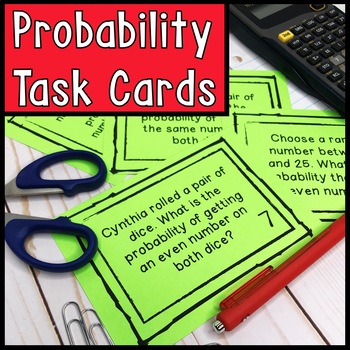
Probability Word Problems Task Cards
Task cards are the multi-functional activity you need for your classroom! Students will practice finding probability. The task cards are aligned to 7th grade TEKS in Texas, but can be used anytime you teach or review probability! How to prep your task cards:•Print•Cut•Laminate•Store in plastic baggies, photo bins, or punch a hole in the corner and keep on a ring! How to use your task cards in your class:•Extra practice for early finishers•“Scoot” game•Stations•Warm-up or Bellringer•Whole class r
Subjects:
Grades:
5th - 8th
Types:
Also included in: 7th Grade Math Task Card Bundle
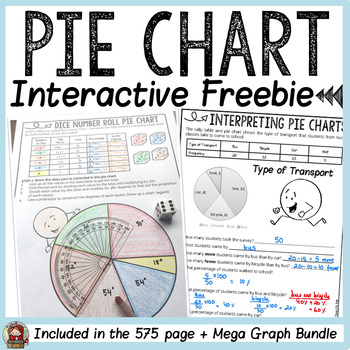
PIE CHARTS/ PIE GRAPHS/ CIRCLE GRAPHS FREEBIE
This freebie on interpreting and creating a pie chart is a sampler activity from the Mega Graphs Bundle.ITEMS INCLUDED✅ A poster defining a Pie Chart.✅ A one-page activity sheet to interpret collated data on mode of transport to school.✅ A one-page activity sheet that requires students to roll a dice and collect and interpret data. They will also find the percent and proportion of each sector to construct a pie chart using a protractor.✅ Answer key/completed sample of each graphing activity.****
Subjects:
Grades:
2nd - 6th
Types:
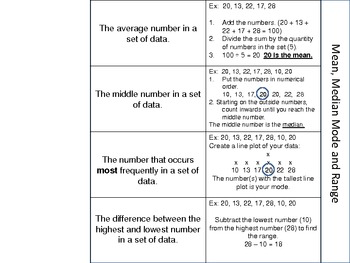
Mean, Median, Mode & Range Math Foldable
You can use this foldable to introduce mean, median, mode and range. Students can easily paste it into their notebooks or file it away in a math folder!
Subjects:
Grades:
4th - 6th
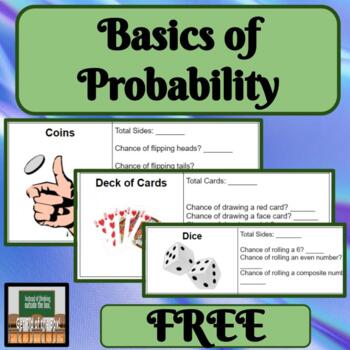
Basics of Probability Dice Cards Coins
About this Resource:Many students do not know all that is needed about dice, coins, and decks of cards. In order to be successful, it is important to cover all of this information first. Topic Covered:*Probability Ways to use this product in your classroom:-whole class-exploration-hands-on-small group-independent Other products with similar content.M&M's ProbabilityBox Plots with WeatherVisuals with Measures of Central TendencyCreating Line Plots
Subjects:
Grades:
6th - 9th
Types:
Also included in: Probability Bundle Hands On Dice Cards Coins Simple Probability
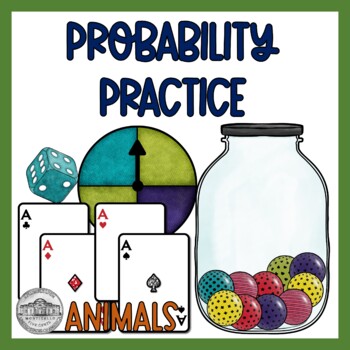
Probability Activity Worksheets and Problems Freebie
Probability is the topic of this worksheet and problems pack, and you'll cover the basics with this set of notes and problems. Students take notes on probability, outcomes, and events as well as standard outcomes expected with coins, dice, marbles, spinners, cards, and words. Then two pages of problems are presented for discussion and practice. This pack also includes a higher level thinking question for students to reflect on and answer as well. All answer keys are included in full color. S
Subjects:
Grades:
5th - 7th
Types:
CCSS:
Also included in: Probability Activity Bundle with Presentation TaskCards and Activity
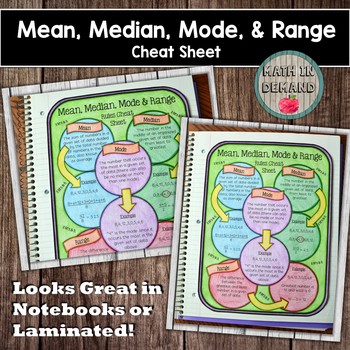
Mean, Median, Mode, and Range Cheat Sheet
Included is a cheat sheet on mean, median, mode, and range. You can have students place the cheat sheet in their interactive notebooks, or you can laminate the cheat sheet and use it year after year!
Subjects:
Grades:
6th - 8th
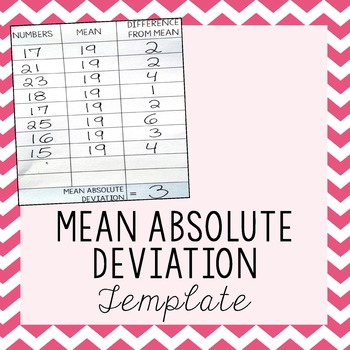
Mean Absolute Deviation Template
I created this template to help my students work through the steps of calculating Mean Absolute Deviation. The helped my students immensely and I hope it will help yours as well.I hope you will explore my other Mean Absolute Deviation products to help complete your unit:Mean Absolute Deviation MazeMean Absolute Deviation Activity with Zombies!Related Resourceso Click Here for more 8th Grade Math activitiesThis product is also part of the following money saving bundle:8th Grade Math Bundle - All
Subjects:
Grades:
6th - 12th
Types:
Also included in: 8th Grade Math Bundle ~ All My 8th Grade Math Products at 1 Low Price
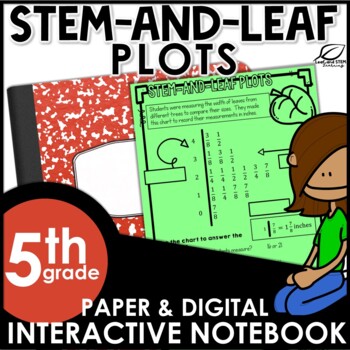
Stem-and-Leaf Plots Interactive Notebook Set | FREE | Distance Learning
Introduce creating and solving one-step and two-step problems using stem and leaf plots. This interactive math notebook set focuses on the Texas TEKS 5.9A and 5.9C. Parts of this set are also appropriate for use with Texas TEKS 4.9A and 4.9B. The stem-and-leaf plots included in this math interactive notebook set use whole numbers, fractions, and decimal values. Also included are a practice activity and a writing activity as well as a 4 question formative test prep style assessment. This fun
Subjects:
Grades:
4th - 6th
Also included in: 5th Grade Math Interactive Notebook - ALL TEKS - ALL CCSS
Probability Stations
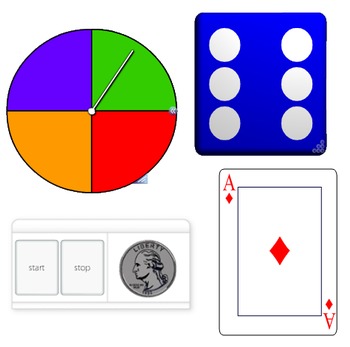
This is a probability station activity I designed for my very active 7th grade math classes. This mostly focuses on independent and dependent events with two game stations thrown in for a brain break. Resources were compiled from other activities available - adapted to fit the needs of my students.
Subjects:
Grades:
6th - 8th
Types:
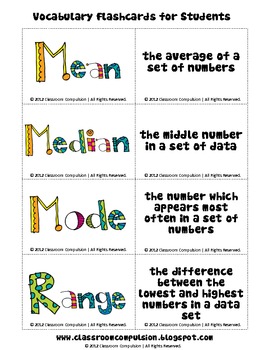
FREE Mean Median Mode Range Fun Flashcards
This is a freebie from my Mean, Median, Mode, and Range Pack. These are fun, colorful flashcards that your students can use to help them learn math vocabulary.
Subjects:
Grades:
3rd - 9th
Types:
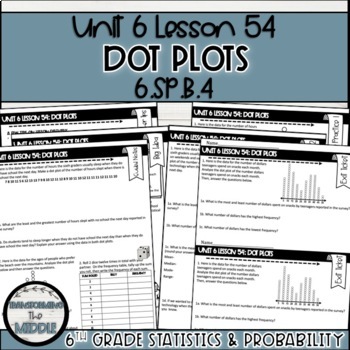
Freebie Dot Plots Lesson | 6th Grade Math
This Dot PLots lesson is a free, fully aligned lesson for 6th grade Math Common Core standards 6.SP.B.4 and 6.SP.B.5. In this lesson, students will learn how to read a data set to create a dot plot. Students will learn how to display the data, analyze it, and make observations about the data set. About This Product:-PDF printable-14 page printable lesson includes:1 teacher overview/product page1 lesson notes page that explains the standards and flow of the lesson1 teacher tips page that explains
Subjects:
Grades:
6th
Types:
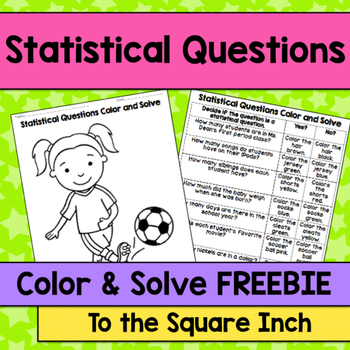
Statistical Questions Color and Solve No Prep Activities, CCS: 6.SP.1 *FREEBIE*
Statistical Questions Color and Solve No Prep Activities, CCS: 6.SP.1 *FREEBIE*
Looking for a fun and engaging, no prep activity to get your students practicing identifying statistical and non-statistical questions?! Check out this color and solve activities! Students will determine whether the given questions are statistical or non-statistical. Once students find their answers, they are directed to color each part of the picture a different color. This activities are self checking!
Check ou
Subjects:
Grades:
5th - 8th
Types:
Construct a Survey Lesson/Project Plan
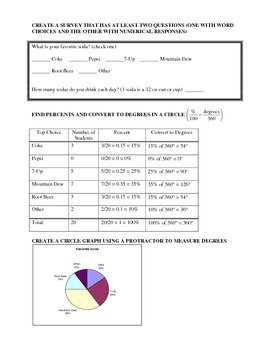
This PDF document consists of three parts: a lesson plan, project instructions, and a grading rubric. The lesson has students construct a survey that will have at least two questions: one that is multiple choice and one that has a numerical answer. It can either be an individual assignment or a group assignment and takes 2-3 days. I used this towards the end of the year as a review exercise since it covers multiple concepts: percents, circle graphs, central tendency (with outliers), box-and-whis
Subjects:
Grades:
6th - 9th
Types:
Mario's Dilemma {Mean, Median, Mode, and Range Activity}
This real-world mean, median, mode, and range activity is perfect for use in grades 6-7. Students are asked what would happen to each measure when a student earns a low test score, then describes the changes for each measure. Students are also asked to calculate and describe the change in a grade when a student studies for a test and when they do not. They are able to see how each measure is affected.
Enjoy :)
Kendra Passarelli
Visit my blog at: This Little Ladybug
ThisLittleLadybug@gmail.co
Subjects:
Grades:
6th - 7th
Types:
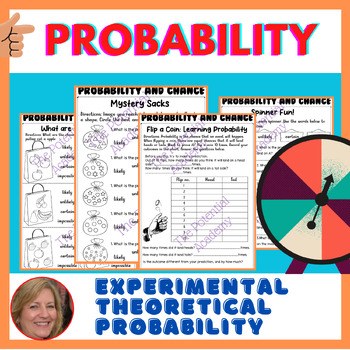
Chance and Probability, Theoretical & Experimental Probability Activities (FREE)
Do your children have trouble determining the likelihood of events and situations? Then this Probability and Chance package is for you! This set is packed with full worksheets and activities to teach your children all about Probability & Chance.There is a set of questions about Probability and Chance for a student to get to know the concept of Probability through the language of change: likely, unlikely, certain, impossible, more likely, less likely, and equally likely, certain, likely, unli
Subjects:
Grades:
5th - 7th
Types:
Showing 1-24 of 371 results


